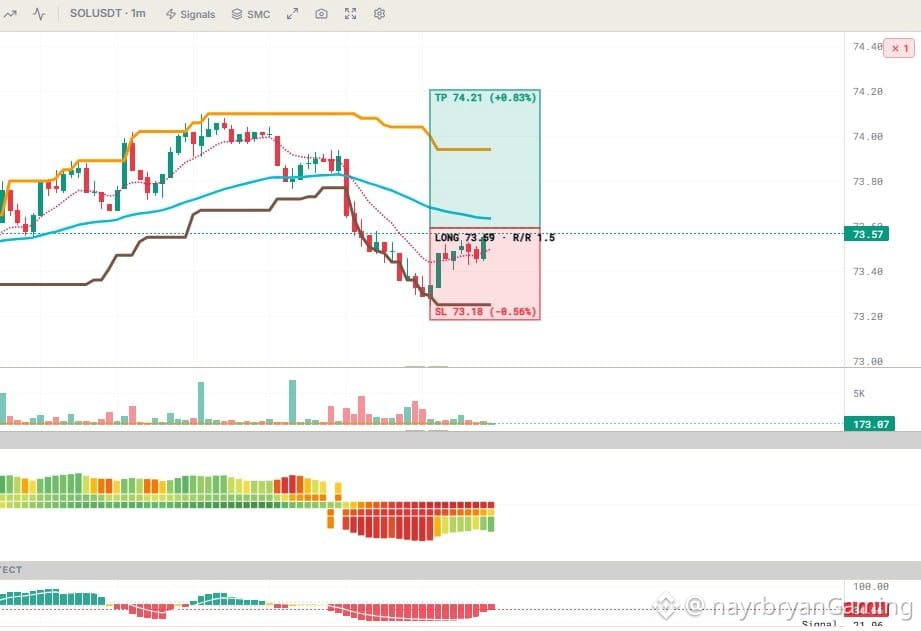
LIGHT ANALYSIS / CHART SETUP — SOL/USDT
📈 STRUCTURE OVERVIEW
Market Phase:
Sharp decline → Relief rebound → Potential bullish continuation
Trading Direction:
LONG
Entry:
73.59
Current Price:
73.57
Take Profit:
74.21
Stop-Loss:
73.18
Potential Return:
+0.83%
Maximum Planned Risk:
-0.56%
Risk/Reward:
1:1.5
---
📌 WHAT I'M WATCHING
SCENARIO A — BULLISH CONTINUATION
If SOL maintains the entry region around 73.59 and buying momentum strengthens, price may attempt to advance toward:
74.21
Watch for sustained buying pressure and stronger momentum confirmation.
SCENARIO B — FAILED RECOVERY
If SOL fails to maintain its recovery and loses the predefined invalidation level:
73.18
The displayed LONG setup becomes invalid.
Avoid assuming that every temporary rebound will develop into a sustained reversal.
---
📊 INDICATOR CHECK
Price Action:
Recovery attempt after a sharp decline.
Trend Reference:
Turquoise moving average / trend line.
Momentum:
Bearish histogram pressure appears to be easing but remains a confirmation point.
Entry Reference:
73.59.
Target:
74.21.
Invalidation:
73.18.
Risk/Reward:
1:1.5.
---
📝 CHART NOTE
The current setup presents a predefined LONG scenario with a 1.5 risk/reward ratio.
The important factor is whether price can sustain its recovery rather than simply produce a temporary bounce.
Wait for confirmation and respect the displayed invalidation level.
Educational chart framework only.
— @nayrbryanGaming
#SOLAnalysis #ChartSetup #LongSetup #PriceAction #CryptoTrading #TechnicalAnalysis #RiskManagement #DYOR #NFA
━━━━━━━━━━━━━━━━━━
📈 STRUCTURE OVERVIEW
Market Phase:
Sharp decline → Relief rebound → Potential bullish continuation
Trading Direction:
LONG
Entry:
73.59
Current Price:
73.57
Take Profit:
74.21
Stop-Loss:
73.18
Potential Return:
+0.83%
Maximum Planned Risk:
-0.56%
Risk/Reward:
1:1.5
---
📌 WHAT I'M WATCHING
SCENARIO A — BULLISH CONTINUATION
If SOL maintains the entry region around 73.59 and buying momentum strengthens, price may attempt to advance toward:
74.21
Watch for sustained buying pressure and stronger momentum confirmation.
SCENARIO B — FAILED RECOVERY
If SOL fails to maintain its recovery and loses the predefined invalidation level:
73.18
The displayed LONG setup becomes invalid.
Avoid assuming that every temporary rebound will develop into a sustained reversal.
---
📊 INDICATOR CHECK
Price Action:
Recovery attempt after a sharp decline.
Trend Reference:
Turquoise moving average / trend line.
Momentum:
Bearish histogram pressure appears to be easing but remains a confirmation point.
Entry Reference:
73.59.
Target:
74.21.
Invalidation:
73.18.
Risk/Reward:
1:1.5.
---
📝 CHART NOTE
The current setup presents a predefined LONG scenario with a 1.5 risk/reward ratio.
The important factor is whether price can sustain its recovery rather than simply produce a temporary bounce.
Wait for confirmation and respect the displayed invalidation level.
Educational chart framework only.
— @nayrbryanGaming
#SOLAnalysis #ChartSetup #LongSetup #PriceAction #CryptoTrading #TechnicalAnalysis #RiskManagement #DYOR #NFA
━━━━━━━━━━━━━━━━━━