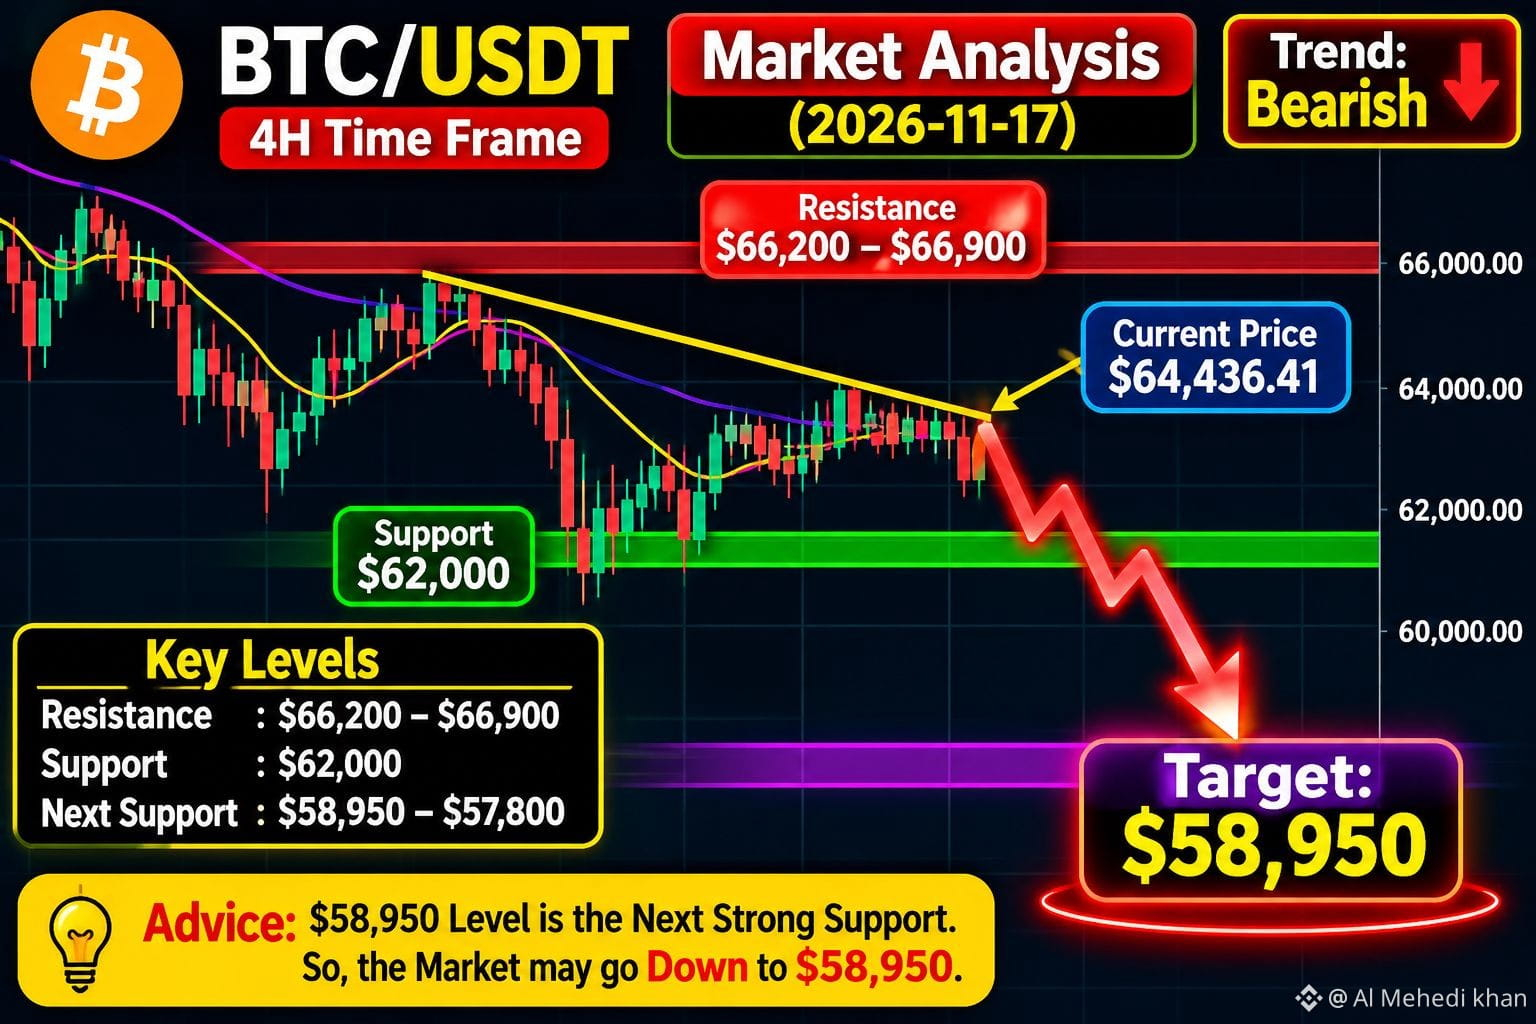
BTC/USDT Market Analysis 📉 | Bearish Outlook
Current Price: $64,436.41
Timeframe: 4H
Analysis Date: November 17, 2026
🔴 Market Bias: BEARISH
Based on the chart analysis, Bitcoin is currently showing significant bearish pressure across higher timeframes.
📌 Important Price Levels:
🔹 Resistance 1: $65,100
🔹 Major Resistance: $66,200 – $66,900
🔹 Key Support: $62,000
🔹 Next Support Zone: $58,950 – $57,800
📉 Bearish Scenario:
If BTC loses the $62,000 support zone, further downside toward $58,950 could become possible.
📈 Bullish Invalidation:
If BTC reclaims $65,100 and breaks above the $66,200–$66,900 resistance zone, the bearish outlook may weaken.
🎯 My Personal Market Bias: DOWN
This is a technical analysis based on the available chart data, not a prediction of guaranteed market movement.
⚠️ Risk Disclaimer: This post is for educational and informational purposes only. It is not financial or investment advice. Cryptocurrency trading involves significant risk, and you can lose your entire investment. Always do your own research (DYOR) before making any financial decisions.
💬 What is your opinion? Will BTC break below $62K or recover from this zone?
#BTC #BTCUSDT! #CryptoAnalysisUpdate #TechnicalAnalysiss #CryptoMarket
Current Price: $64,436.41
Timeframe: 4H
Analysis Date: November 17, 2026
🔴 Market Bias: BEARISH
Based on the chart analysis, Bitcoin is currently showing significant bearish pressure across higher timeframes.
📌 Important Price Levels:
🔹 Resistance 1: $65,100
🔹 Major Resistance: $66,200 – $66,900
🔹 Key Support: $62,000
🔹 Next Support Zone: $58,950 – $57,800
📉 Bearish Scenario:
If BTC loses the $62,000 support zone, further downside toward $58,950 could become possible.
📈 Bullish Invalidation:
If BTC reclaims $65,100 and breaks above the $66,200–$66,900 resistance zone, the bearish outlook may weaken.
🎯 My Personal Market Bias: DOWN
This is a technical analysis based on the available chart data, not a prediction of guaranteed market movement.
⚠️ Risk Disclaimer: This post is for educational and informational purposes only. It is not financial or investment advice. Cryptocurrency trading involves significant risk, and you can lose your entire investment. Always do your own research (DYOR) before making any financial decisions.
💬 What is your opinion? Will BTC break below $62K or recover from this zone?
#BTC #BTCUSDT! #CryptoAnalysisUpdate #TechnicalAnalysiss #CryptoMarket