
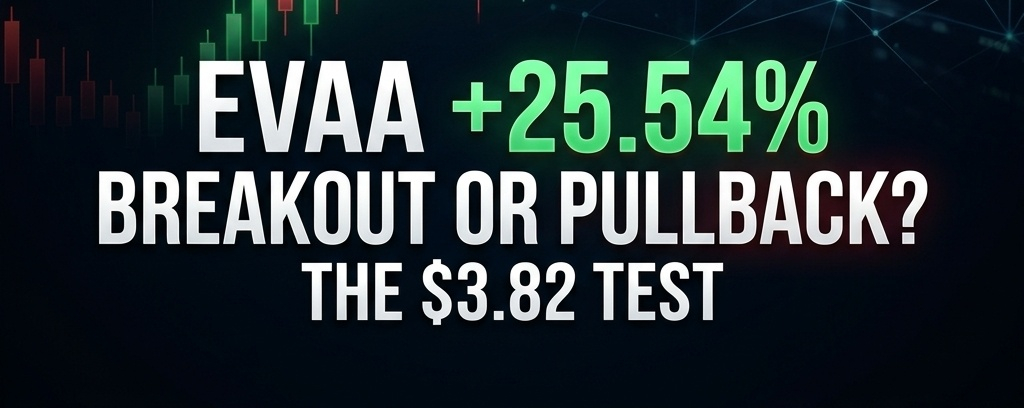

EVAA Protocol has delivered a powerful rally, with EVAA/USDT trading around $3.4061, up approximately 25.54% in the supplied Binance Futures snapshot.
Its 24-hour trading volume has reached approximately $777 million.
But after such a sharp move, one question matters:
Can EVAA extend its rally, or are buyers running out of momentum?
Let's examine all four timeframes.
1. 15-Minute Chart: Short-Term Momentum Slows
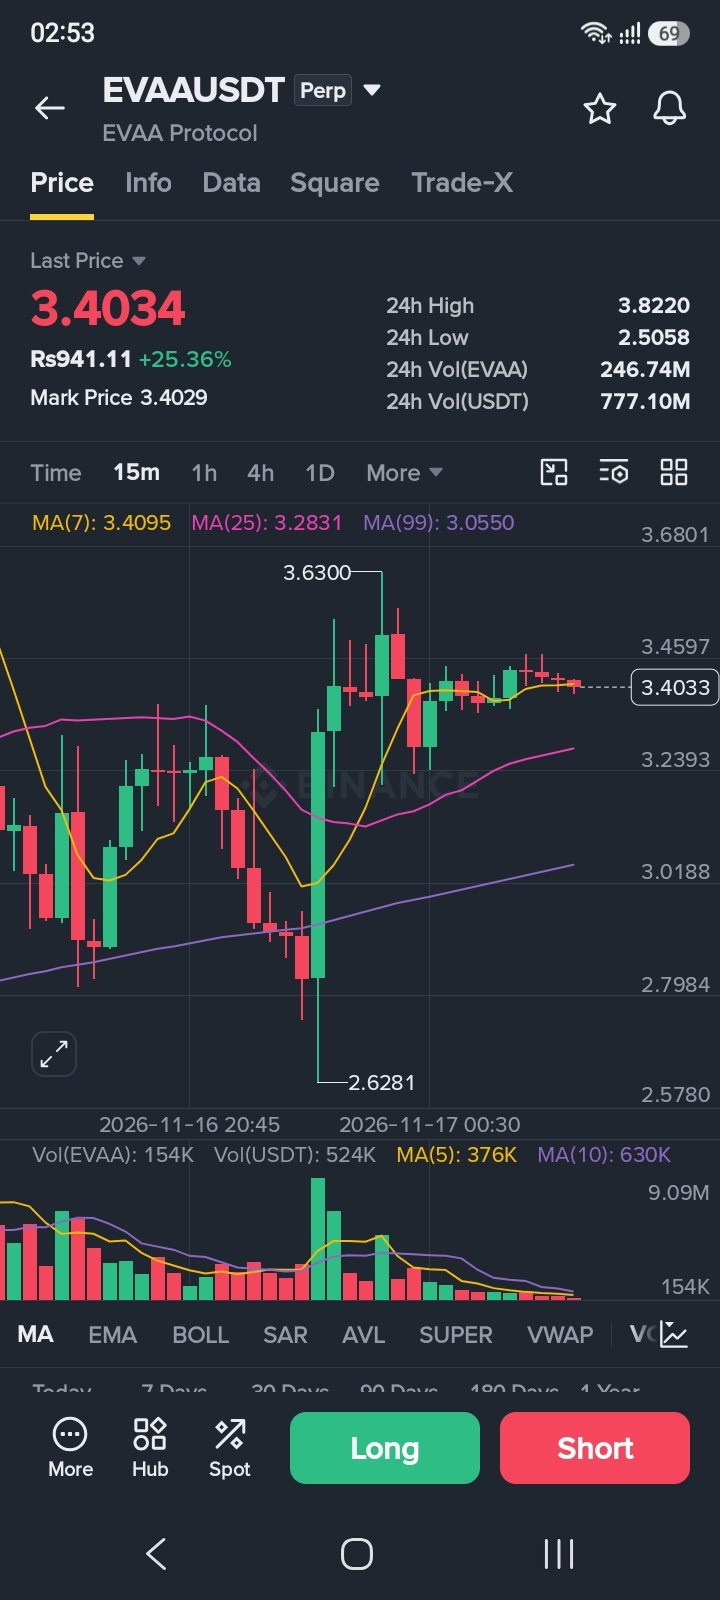
MA(7): $3.4095
MA(25): $3.2831
MA(99): $3.0550
Candle volume: 154K
MA(5) Volume: 376K
MA(10) Volume: 630K
Price is slightly below MA(7), while remaining above MA(25) and MA(99).
This suggests a short-term pause after the rally. Volume is below both averages, so buyers need to return with stronger participation.
2. 1-Hour Chart: Bullish Structure Remains
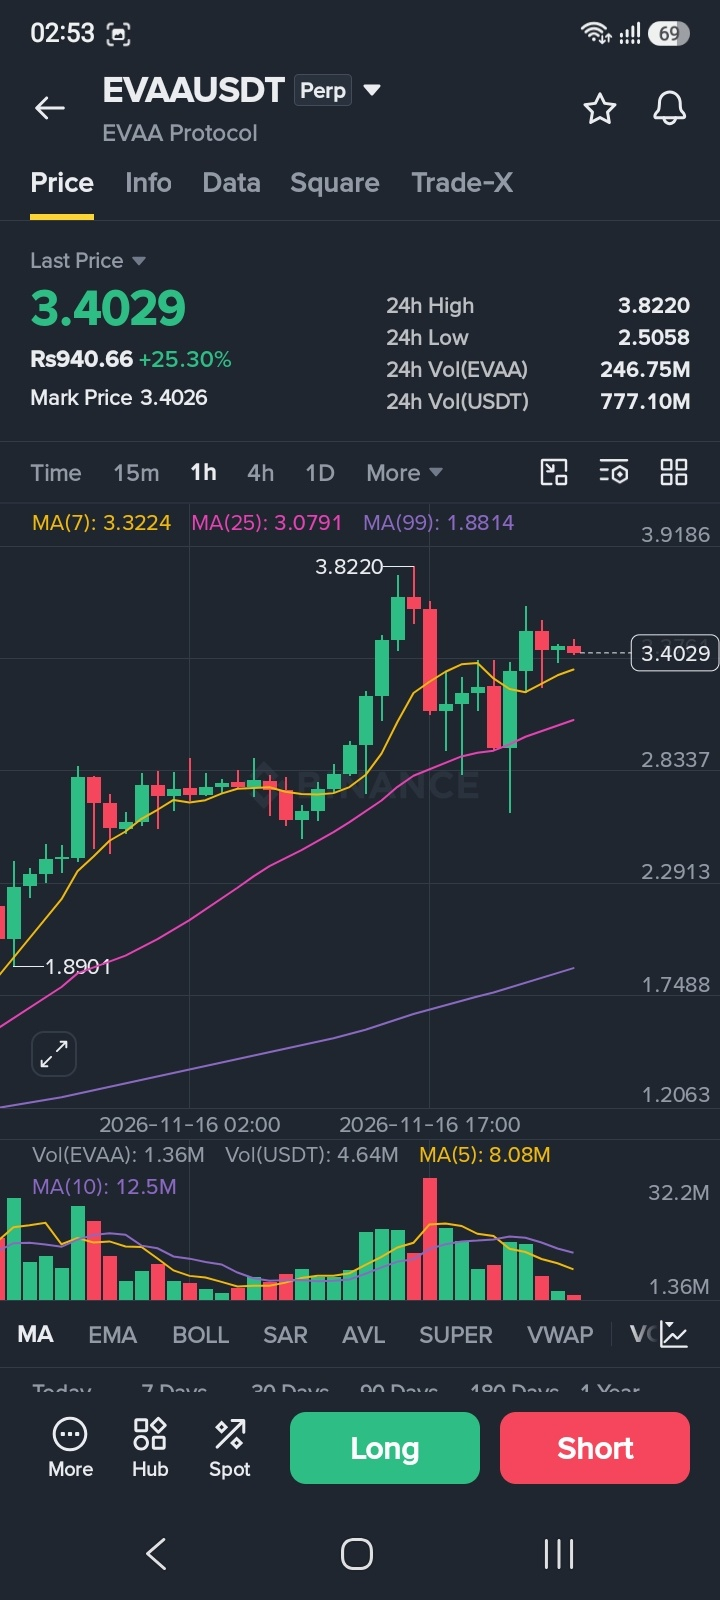
MA(7): $3.3224
MA(25): $3.0791
MA(99): $1.8814
Candle volume: 1.36M
MA(5) Volume: 8.08M
MA(10) Volume: 12.5M
All three moving averages remain below the current price.
This is a bullish structure, but the latest candle volume is much lower than both volume averages. The rally needs fresh confirmation.
3. 4-Hour Chart: Strong Trend, Weak Recent Volume
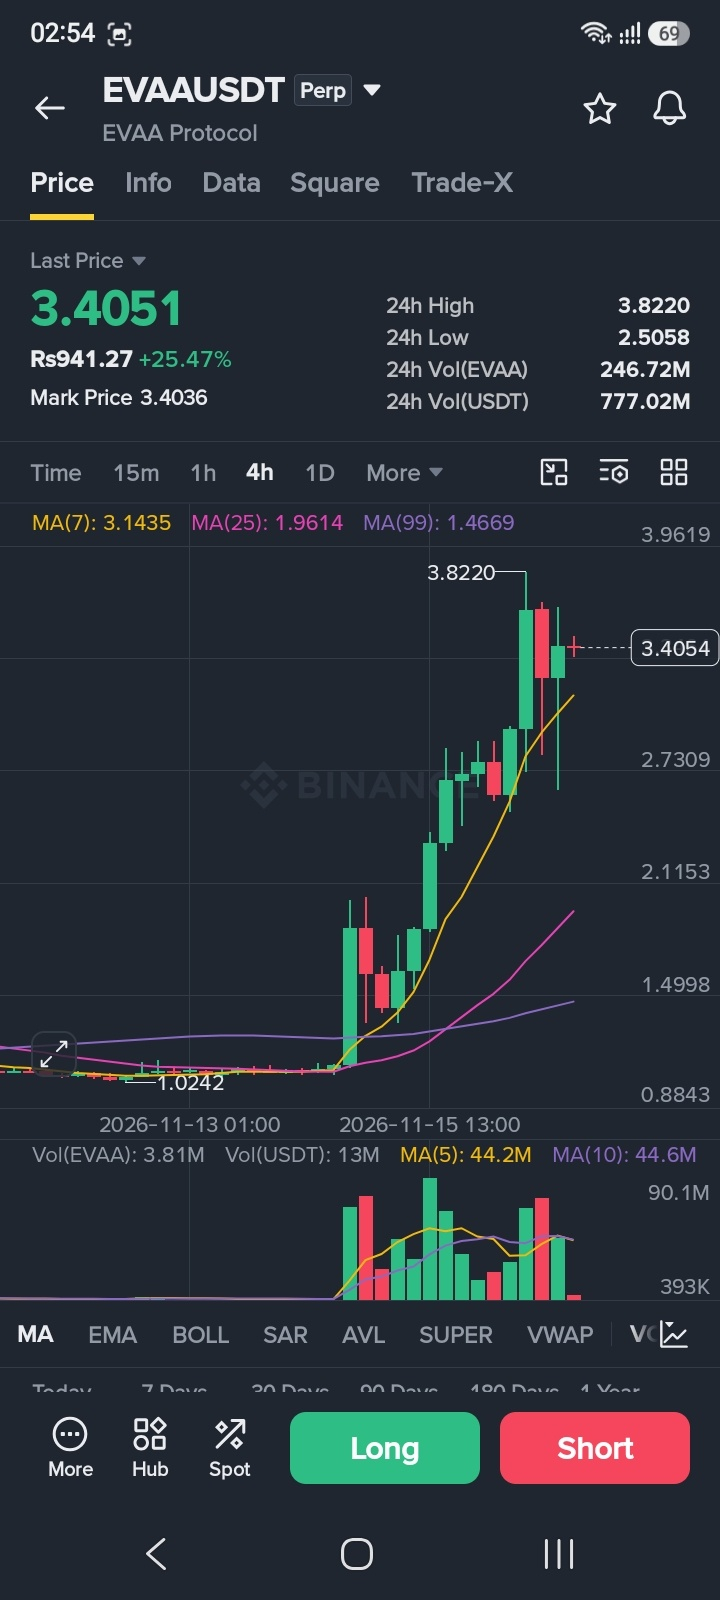
MA(7): $3.1435
MA(25): $1.9614
MA(99): $1.4669
Candle volume: 3.81M
MA(5) Volume: 44.2M
MA(10) Volume: 44.6M
The moving-average structure is strongly bullish.
However, the latest volume is far below its averages. This makes it important to watch whether buyers can sustain the move rather than assuming another immediate surge.
4. Daily Chart: The Biggest Bullish Signal
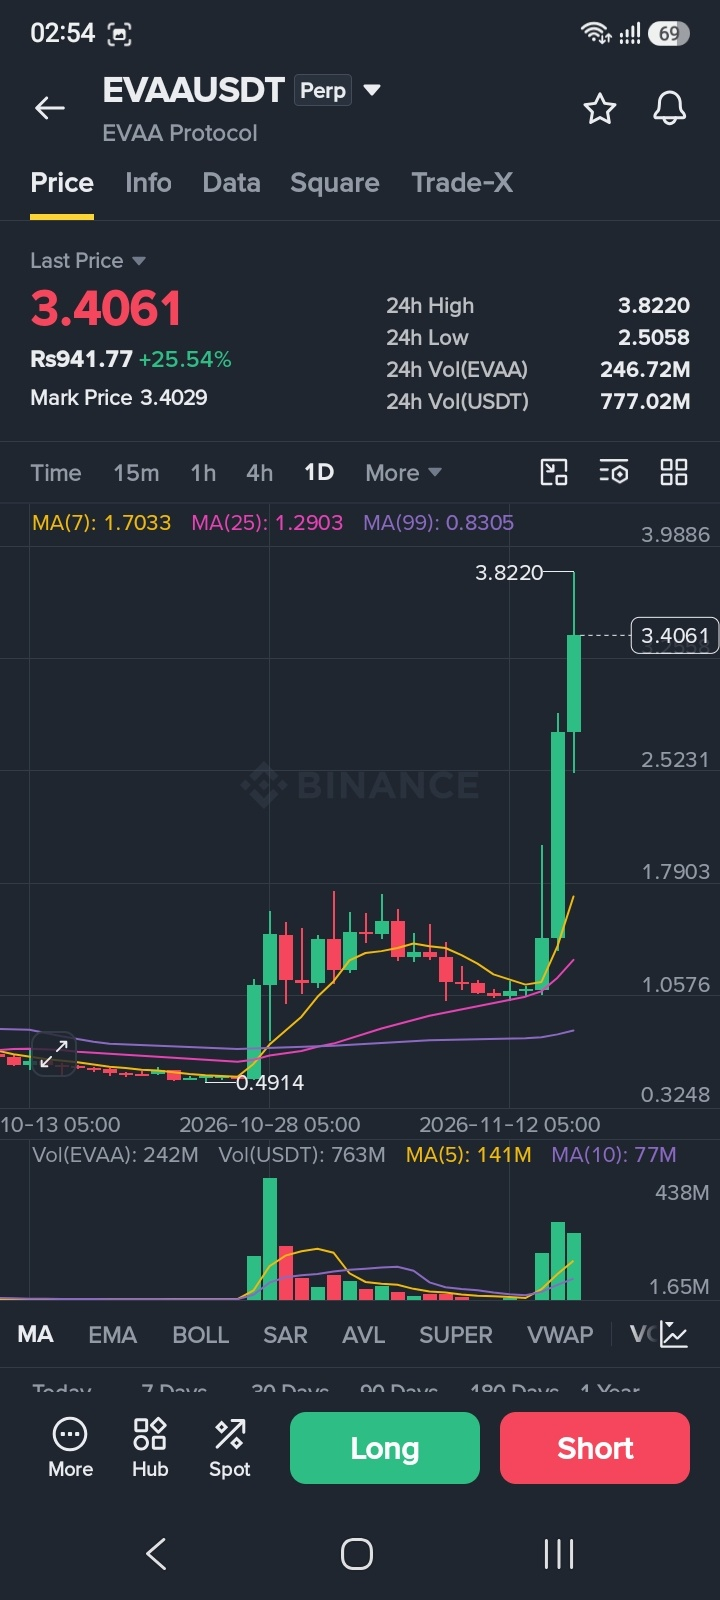
MA(7): $1.7033
MA(25): $1.2903
MA(99): $0.8305
Candle volume: 242M
MA(5) Volume: 141M
MA(10) Volume: 77M
The daily chart shows strong bullish alignment, with price well above all three moving averages.
Daily volume is also above both averages, confirming substantial activity during the broader rally.
Critical Support and Resistance Levels
Resistance:
$3.4597
$3.6801
$3.8220 — 24-hour high
Support:
$3.4095–$3.4030
$3.2831
$3.0791
$2.8337
A sustained move above $3.4597 could bring the $3.68–$3.822 resistance zone into focus.
On the other hand, losing $3.2831 could signal a deeper cooling-off phase.
Final Verdict: Can EVAA Continue Its Rally?
The 1H, 4H and Daily moving-average structures remain bullish. The daily volume reading is also encouraging.
However, short-term volume has cooled significantly, and the 15-minute chart is showing a pause.
The key question is whether EVAA can break above $3.46 with renewed volume — or whether sellers will push it toward lower support levels first.
What is your prediction?
🚀 Another breakout toward $3.82
🐻 A pullback toward $3.28
⚖️ Sideways consolidation before the next move
Share your analysis below!
Disclaimer: This analysis uses the Binance Futures screenshots supplied for this article. It is educational, not financial advice. High volatility can create substantial risk.
#EVAA #EVAAProtocol #BinancePick #CryptoAnalysis #TechnicalAnalysis #altcoins