🚨 LUNC/USDT – TERRA CLASSIC: IS THE NEXT BIG MOVE COMING? 🚀🔥
📊 Let's talk about what the chart is telling us!
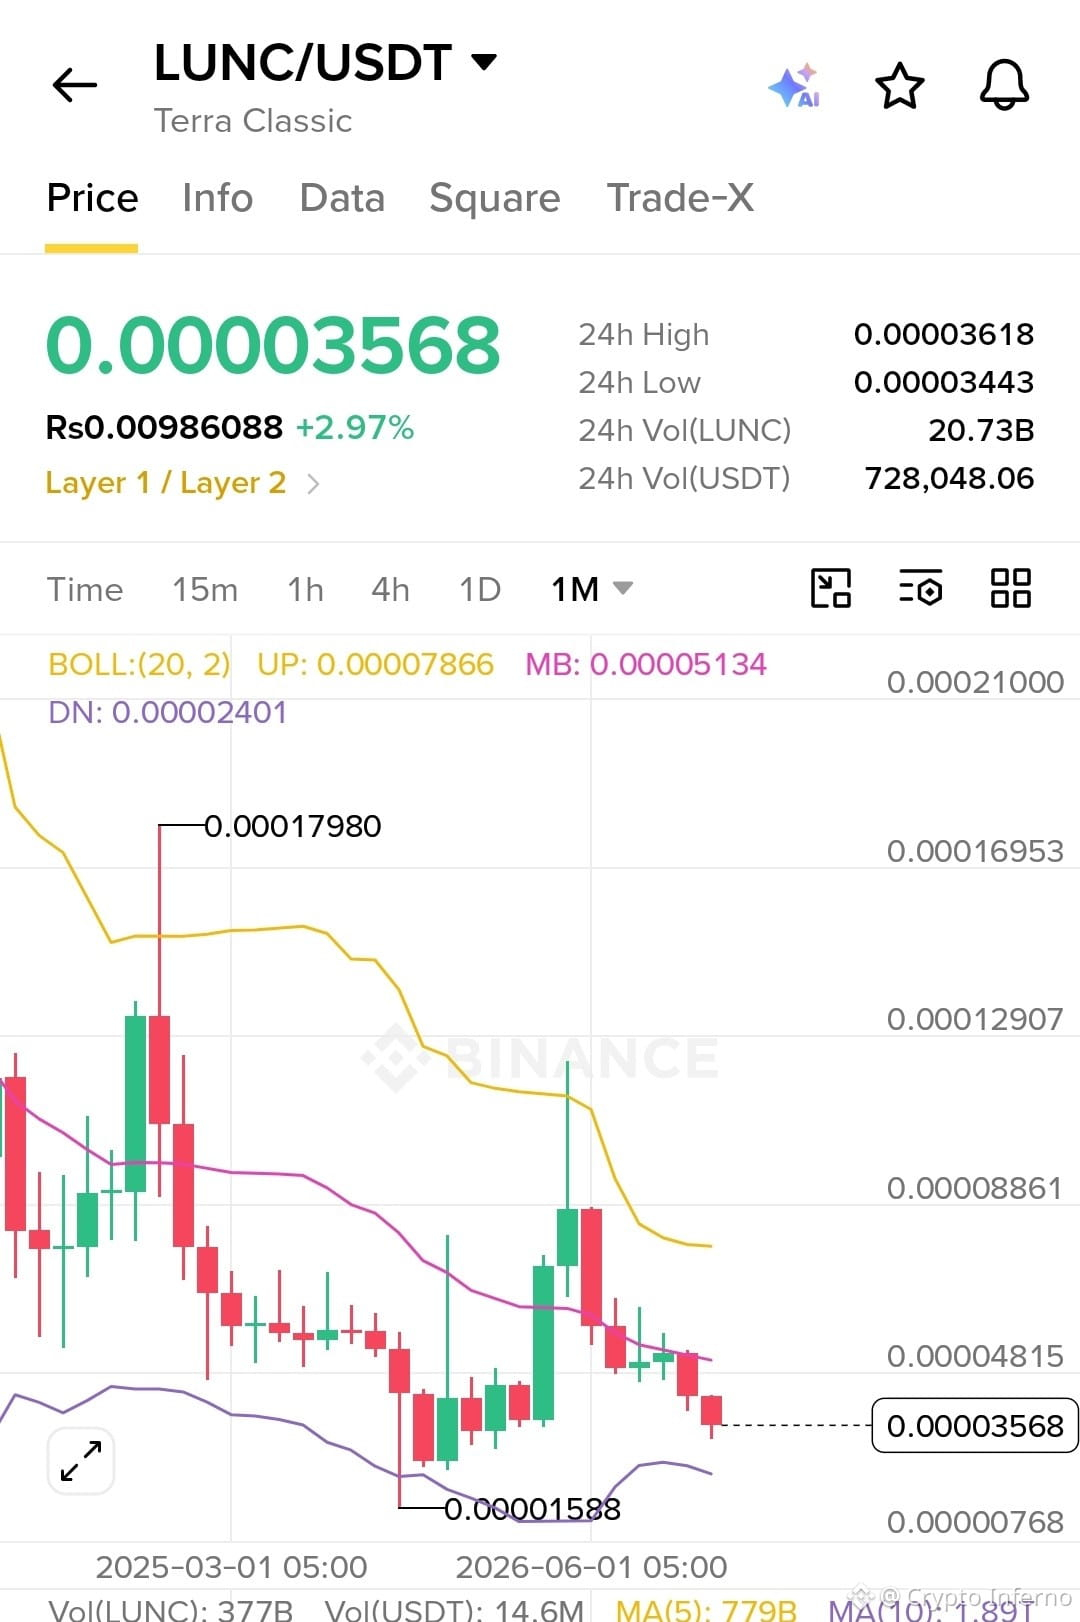
Terra Classic ($LUNC ) is currently trading around 0.00003568 USDT, showing a 24-hour gain of +2.97%. 🟢
Looking at the 1M (monthly) chart, we can identify some important technical signals:
🔻 1. Long-Term Downtrend The overall chart structure remains bearish, with lower price levels over time. The price is still trading below the middle Bollinger Band, suggesting that bullish momentum has not yet taken control.
📉 2. Bollinger Bands Analysis
Upper Band: 0.00007866
Middle Band: 0.00005134
Lower Band: 0.00002401
LUNC is trading below the middle band, indicating continued bearish pressure. However, the lower band could act as a potential support zone.
🟢 3. Important Support Zone The previous chart low is around 0.00001588. This is an important historical level to watch if selling pressure returns.
🚀 4. Key Resistance Levels
First resistance: 0.00004815
Major resistance: 0.00005134
Stronger resistance: 0.00007866
A sustained monthly move above the middle Bollinger Band could improve the bullish outlook.
🐂 5. What Could Happen Next?
If buyers step in and LUNC breaks above resistance with strong volume, we could see a recovery attempt toward higher levels.
However, if the price fails to hold its current support area, another downside move remains possible.
💎 MY TAKE: LUNC is showing a small positive 24-hour move, but the monthly chart still needs confirmation of a trend reversal. Patience, volume, and a strong breakout will be important.
🔥 Can Terra Classic surprise the market with another major rally?
👇 Are you BULLISH 🐂 or BEARISH 🐻 on LUNC?
#LUNC #TerraClassic #LUNCUSDT #Crypto #CryptoTrading #Binance #Altcoins #BullRun #CryptoAnalysis #TechnicalAnalysis
📊 Let's talk about what the chart is telling us!
Terra Classic ($LUNC ) is currently trading around 0.00003568 USDT, showing a 24-hour gain of +2.97%. 🟢
Looking at the 1M (monthly) chart, we can identify some important technical signals:
🔻 1. Long-Term Downtrend The overall chart structure remains bearish, with lower price levels over time. The price is still trading below the middle Bollinger Band, suggesting that bullish momentum has not yet taken control.
📉 2. Bollinger Bands Analysis
Upper Band: 0.00007866
Middle Band: 0.00005134
Lower Band: 0.00002401
LUNC is trading below the middle band, indicating continued bearish pressure. However, the lower band could act as a potential support zone.
🟢 3. Important Support Zone The previous chart low is around 0.00001588. This is an important historical level to watch if selling pressure returns.
🚀 4. Key Resistance Levels
First resistance: 0.00004815
Major resistance: 0.00005134
Stronger resistance: 0.00007866
A sustained monthly move above the middle Bollinger Band could improve the bullish outlook.
🐂 5. What Could Happen Next?
If buyers step in and LUNC breaks above resistance with strong volume, we could see a recovery attempt toward higher levels.
However, if the price fails to hold its current support area, another downside move remains possible.
💎 MY TAKE: LUNC is showing a small positive 24-hour move, but the monthly chart still needs confirmation of a trend reversal. Patience, volume, and a strong breakout will be important.
🔥 Can Terra Classic surprise the market with another major rally?
👇 Are you BULLISH 🐂 or BEARISH 🐻 on LUNC?
#LUNC #TerraClassic #LUNCUSDT #Crypto #CryptoTrading #Binance #Altcoins #BullRun #CryptoAnalysis #TechnicalAnalysis