$DODO: Same Hourly Direction, Different Volume Stories
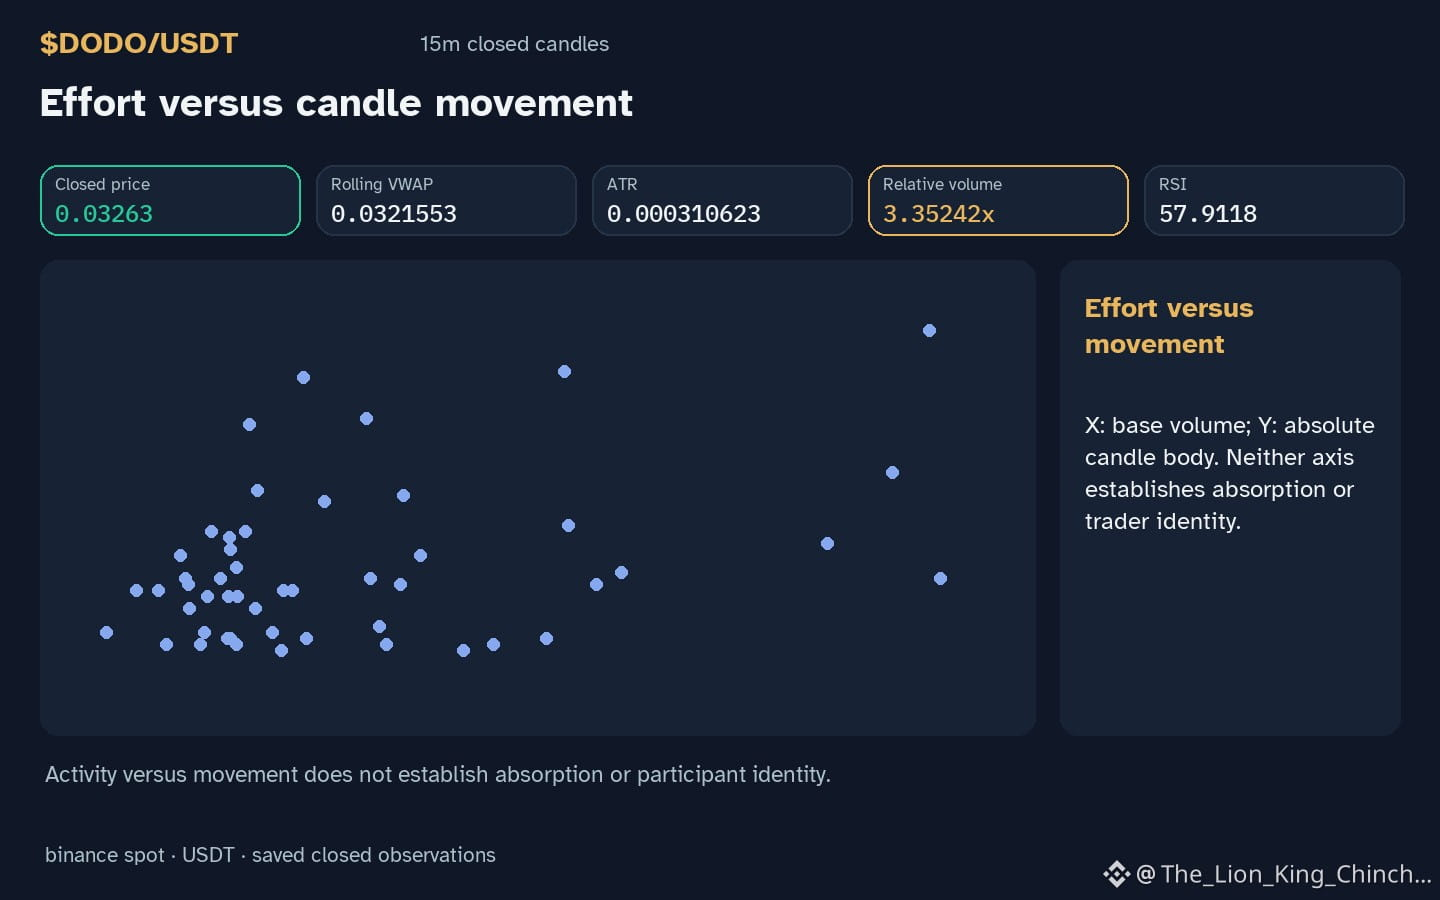
What does it mean when $DODO shows an hourly direction up while volume sits above baseline, yet two peers move identically? The observation notes a price moving inside its recorded range. One might assume identical movement implies identical conviction. However, volume divergence across similar price paths suggests different underlying participation. A hypothetical mechanism involves staggered accumulation where one asset sees broad interest while another experiences retail-only participation. This would produce similar directional movement but different liquidity profiles. The analogy helps explain why identical hourly gains can hide different risk profiles. It fails when assuming volume and price are perfectly synchronized. A counterexample would be a scenario where volume spikes but price stalls, indicating distribution rather than accumulation. To reassess, compare relative volume trends across multiple candles. If volume remains elevated while price approaches resistance, conviction may be weakening despite continued upward movement. $DODO currently trades at 0.03263 with hourly change 0.276583% and relative volume 3.35x baseline. RSI reads 57.9, suggesting room for further movement. The key insight is that identical directional movement does not guarantee identical risk.
Probabilistic market research, not a recommendation or guaranteed return.
Watchlist contrast: $ETH has hourly direction up and volume above its baseline; $GLMR has hourly direction up and volume above its baseline. This alone does not establish correlation.
#DODO #ETH #GLMR #CryptoWatchlist
What does it mean when $DODO shows an hourly direction up while volume sits above baseline, yet two peers move identically? The observation notes a price moving inside its recorded range. One might assume identical movement implies identical conviction. However, volume divergence across similar price paths suggests different underlying participation. A hypothetical mechanism involves staggered accumulation where one asset sees broad interest while another experiences retail-only participation. This would produce similar directional movement but different liquidity profiles. The analogy helps explain why identical hourly gains can hide different risk profiles. It fails when assuming volume and price are perfectly synchronized. A counterexample would be a scenario where volume spikes but price stalls, indicating distribution rather than accumulation. To reassess, compare relative volume trends across multiple candles. If volume remains elevated while price approaches resistance, conviction may be weakening despite continued upward movement. $DODO currently trades at 0.03263 with hourly change 0.276583% and relative volume 3.35x baseline. RSI reads 57.9, suggesting room for further movement. The key insight is that identical directional movement does not guarantee identical risk.
Probabilistic market research, not a recommendation or guaranteed return.
Watchlist contrast: $ETH has hourly direction up and volume above its baseline; $GLMR has hourly direction up and volume above its baseline. This alone does not establish correlation.
#DODO #ETH #GLMR #CryptoWatchlist