🚨 BITCOIN'S NEXT BIG MOVE COULD BE MASSIVE! $53K OR $97K? THE CHART REVEALS AN INTERESTING POSSIBILITY! 🔥
$BTC / USDT
Bitcoin is approaching a critical turning point, and this long-term chart is raising a BIG question: Are we witnessing a temporary correction before another powerful rally?
👀 LOOK AT THESE KEY LEVELS!
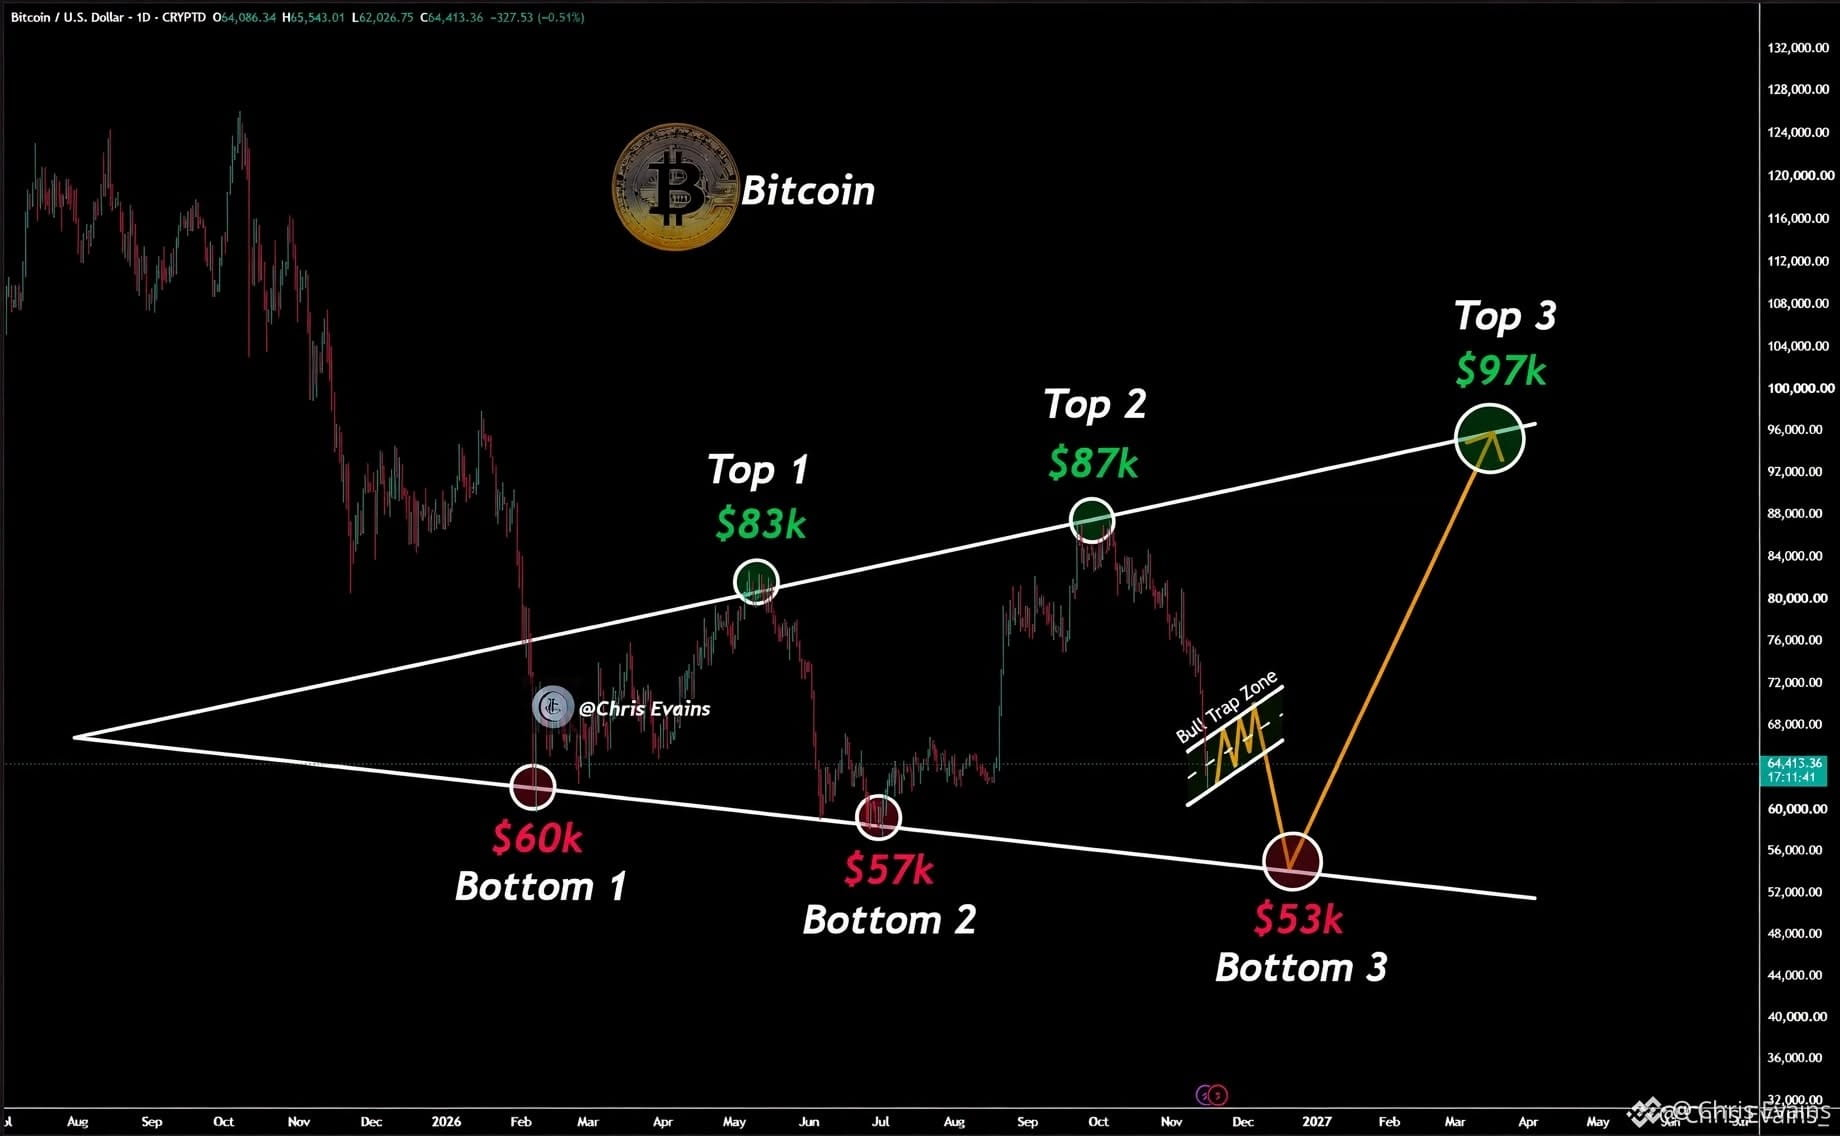
📈 TOP 1 – $83K: First major resistance zone.
📈 TOP 2 – $87K: The next potential bullish target.
🚀 TOP 3 – $97K: A major upside target if Bitcoin successfully breaks out of its descending structure.
⚠️ THE BEARISH SIDE:
🔻 BOTTOM 1 – $60K: Important historical support.
🔻 BOTTOM 2 – $57K: Another critical downside level.
🔻 BOTTOM 3 – $53K: The potential lower support zone highlighted in the chart.
🔥 THE MOST INTERESTING PART:
The chart also highlights a potential Bull Trap Zone around the $65K–$70K region. Bitcoin could experience a short-term recovery, trap impatient buyers, and then retest lower support before attempting a stronger reversal.
MY MARKET TAKE: Bitcoin remains at a crucial decision point. A confirmed breakout with strong buying volume could open the door toward $83K, $87K, and potentially $97K. However, losing support could expose the lower levels.
Remember, these are technical scenarios, NOT guaranteed price predictions.
💥 NOW THE BIG QUESTION:
Will BTC surprise everyone with a massive rally toward $97K, or will bears drag the price down to $53K first?
Are you TEAM BULLS 🐂 or TEAM BEARS 🐻?
Drop your BTC prediction in the comments! Let's see which side the community believes in.
#Bitcoin #BTC #Crypto #Trading #BinanceSquare
$BTC / USDT
Bitcoin is approaching a critical turning point, and this long-term chart is raising a BIG question: Are we witnessing a temporary correction before another powerful rally?
👀 LOOK AT THESE KEY LEVELS!
📈 TOP 1 – $83K: First major resistance zone.
📈 TOP 2 – $87K: The next potential bullish target.
🚀 TOP 3 – $97K: A major upside target if Bitcoin successfully breaks out of its descending structure.
⚠️ THE BEARISH SIDE:
🔻 BOTTOM 1 – $60K: Important historical support.
🔻 BOTTOM 2 – $57K: Another critical downside level.
🔻 BOTTOM 3 – $53K: The potential lower support zone highlighted in the chart.
🔥 THE MOST INTERESTING PART:
The chart also highlights a potential Bull Trap Zone around the $65K–$70K region. Bitcoin could experience a short-term recovery, trap impatient buyers, and then retest lower support before attempting a stronger reversal.
MY MARKET TAKE: Bitcoin remains at a crucial decision point. A confirmed breakout with strong buying volume could open the door toward $83K, $87K, and potentially $97K. However, losing support could expose the lower levels.
Remember, these are technical scenarios, NOT guaranteed price predictions.
💥 NOW THE BIG QUESTION:
Will BTC surprise everyone with a massive rally toward $97K, or will bears drag the price down to $53K first?
Are you TEAM BULLS 🐂 or TEAM BEARS 🐻?
Drop your BTC prediction in the comments! Let's see which side the community believes in.
#Bitcoin #BTC #Crypto #Trading #BinanceSquare