🔴 $SOL /USDT · Bias: SHORT
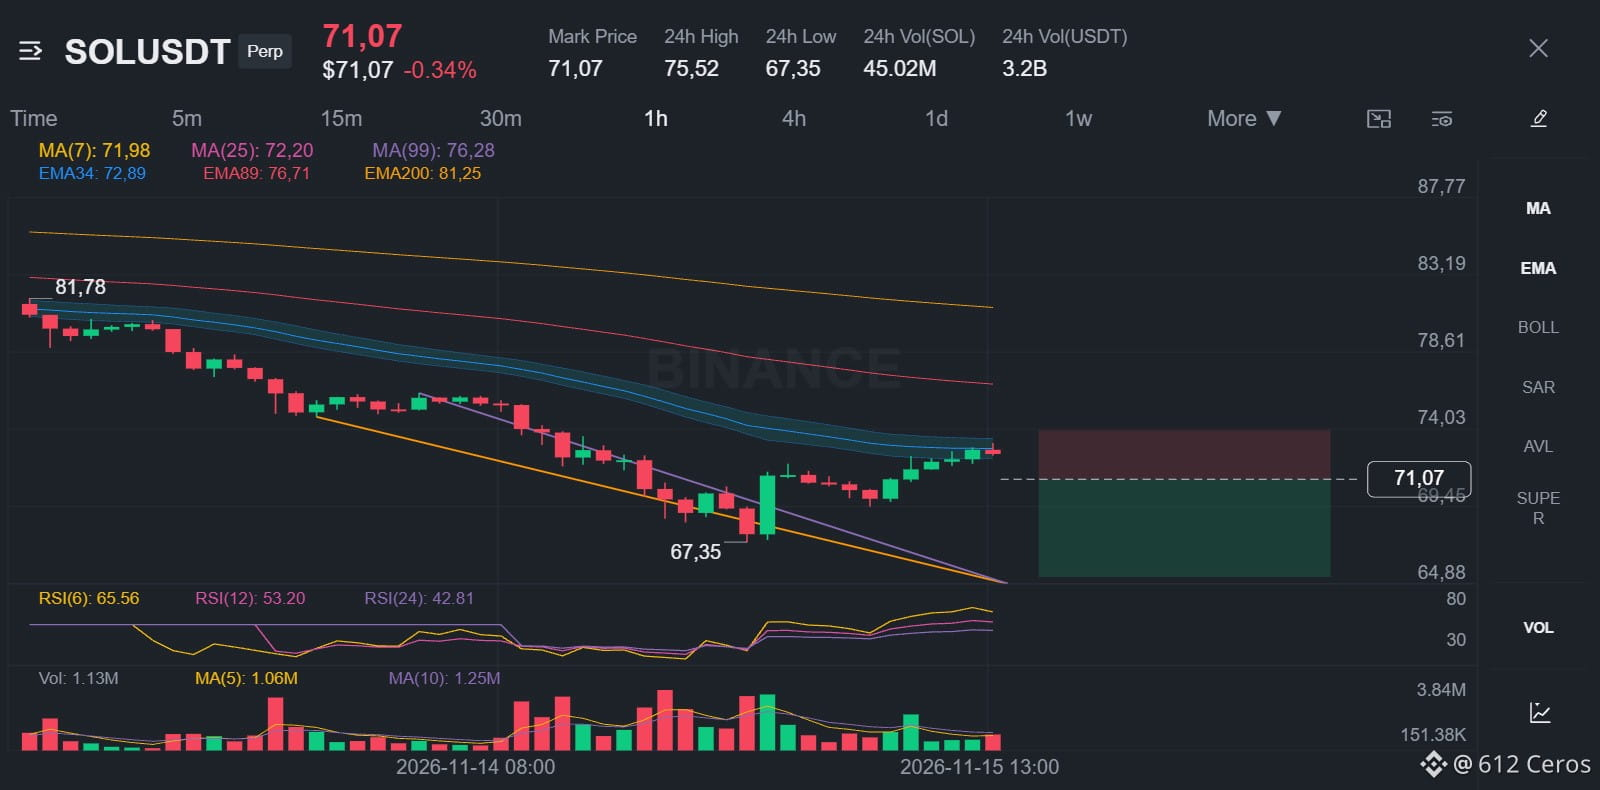
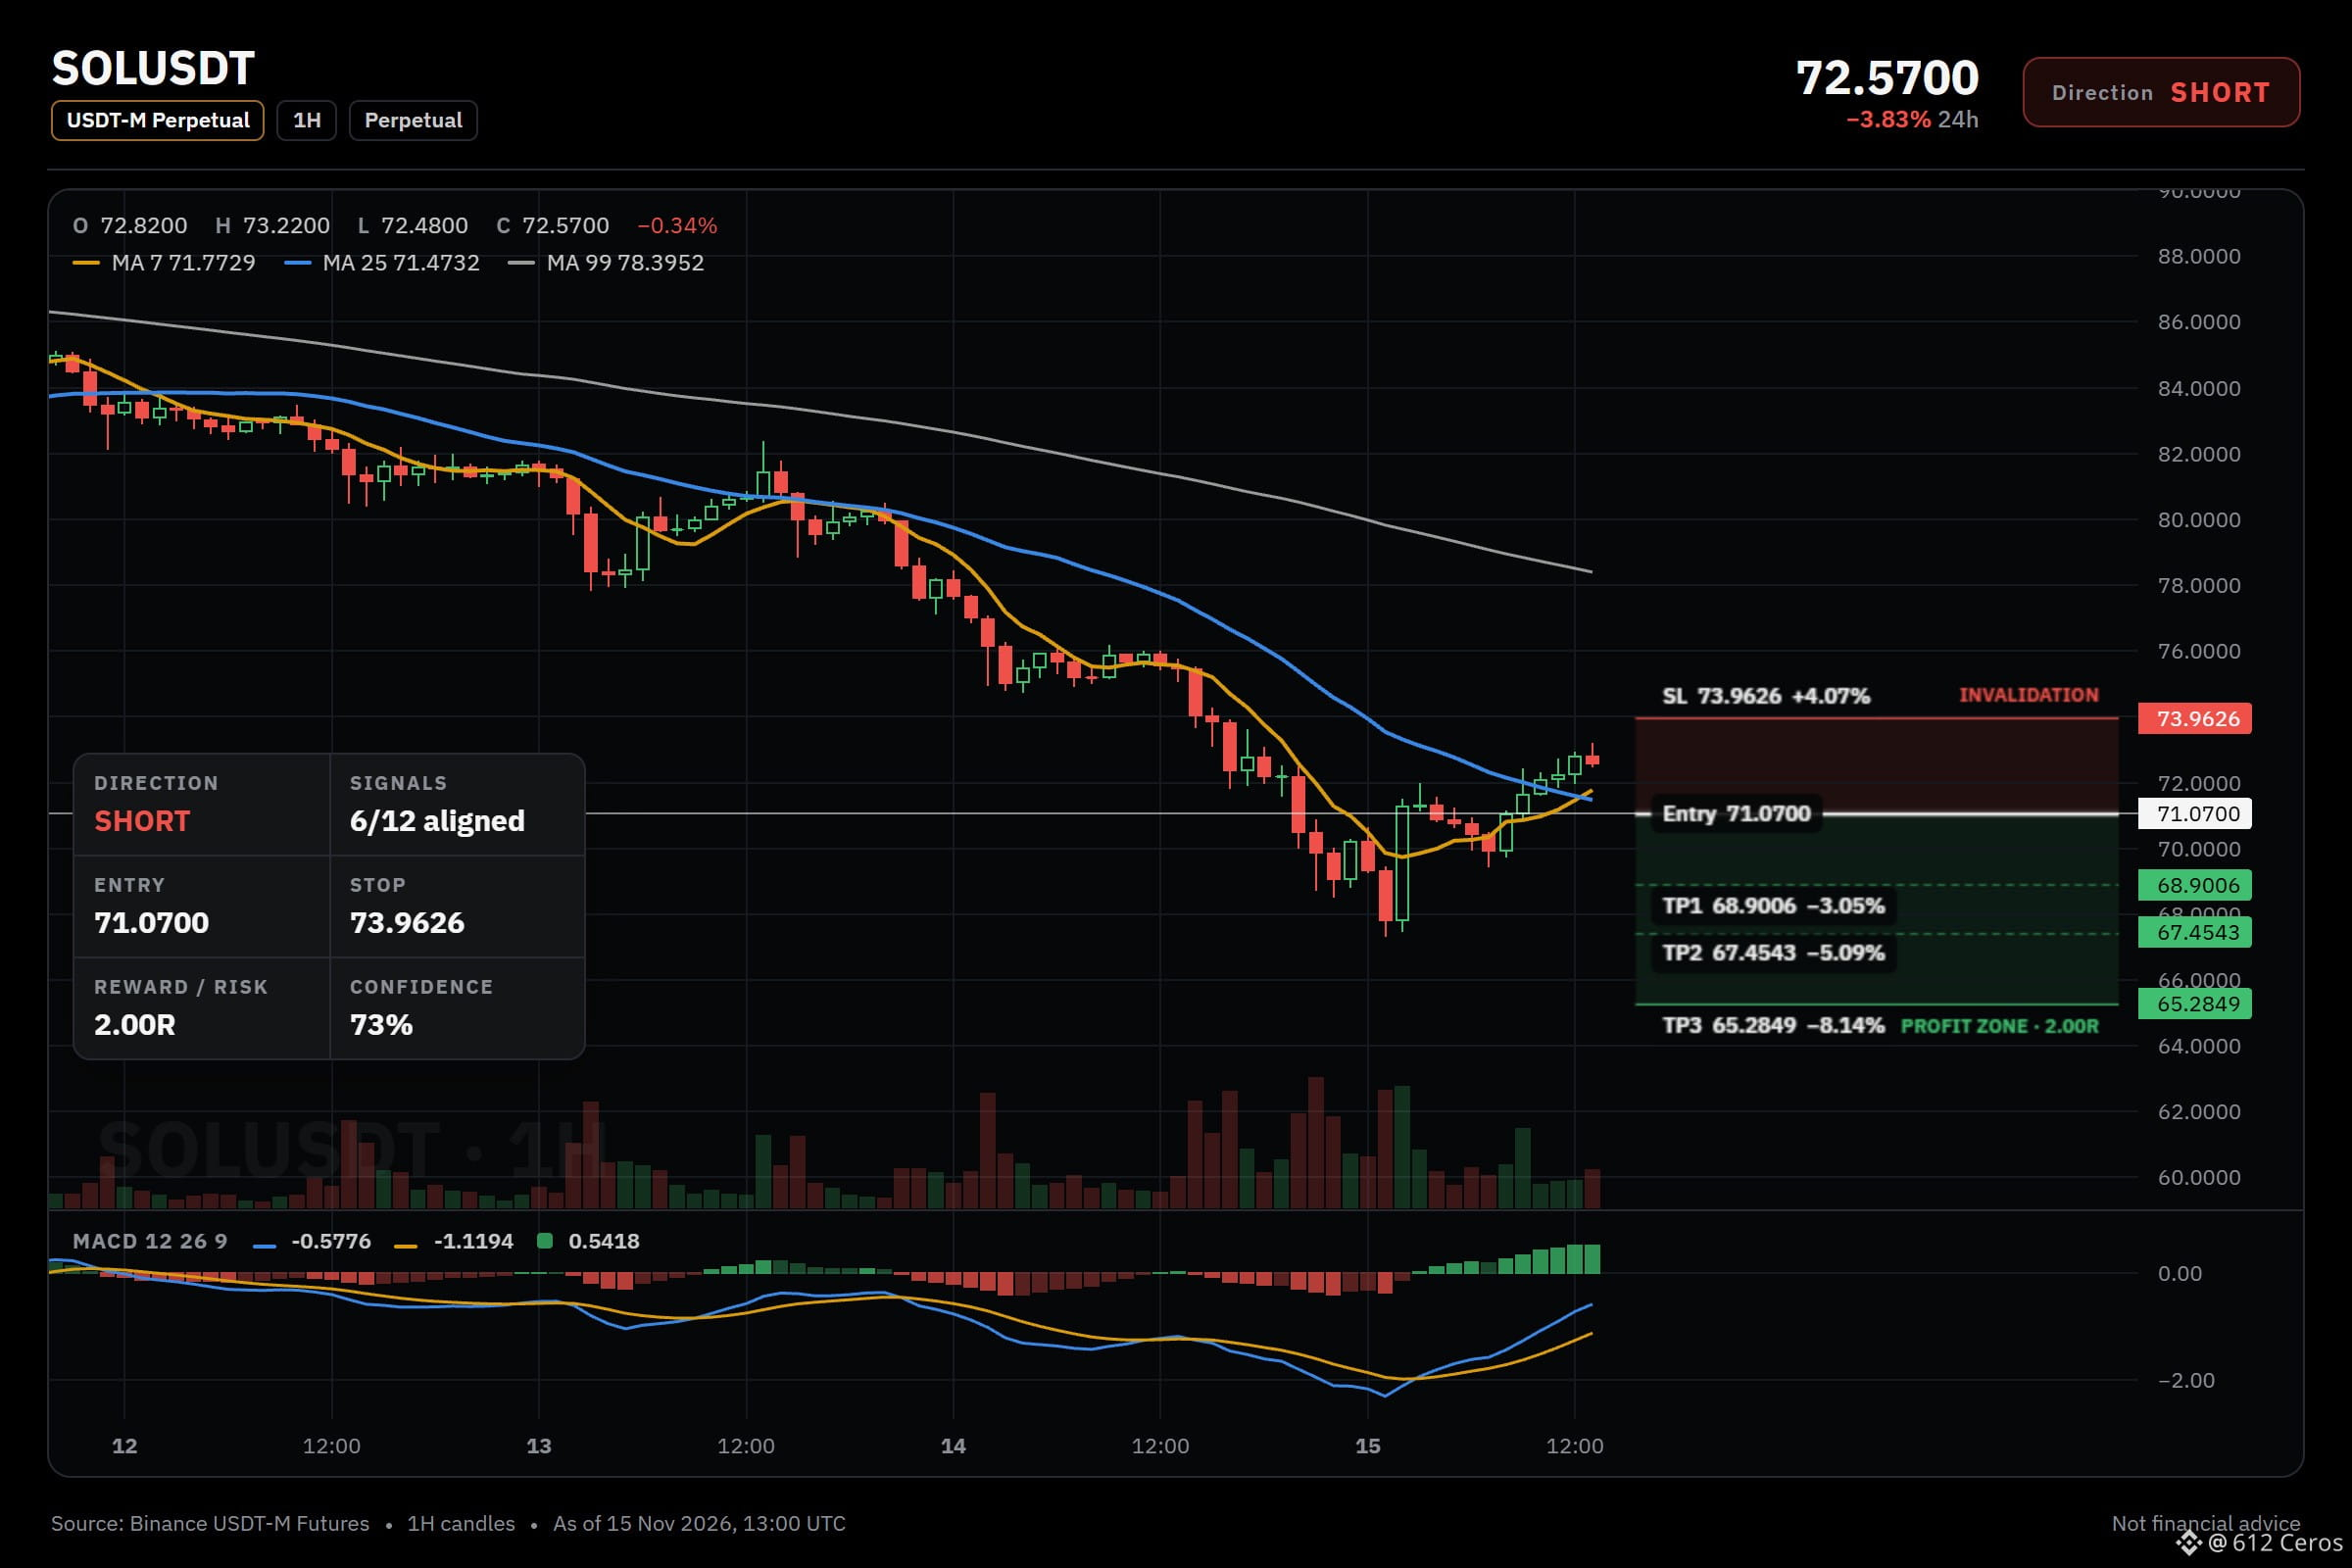
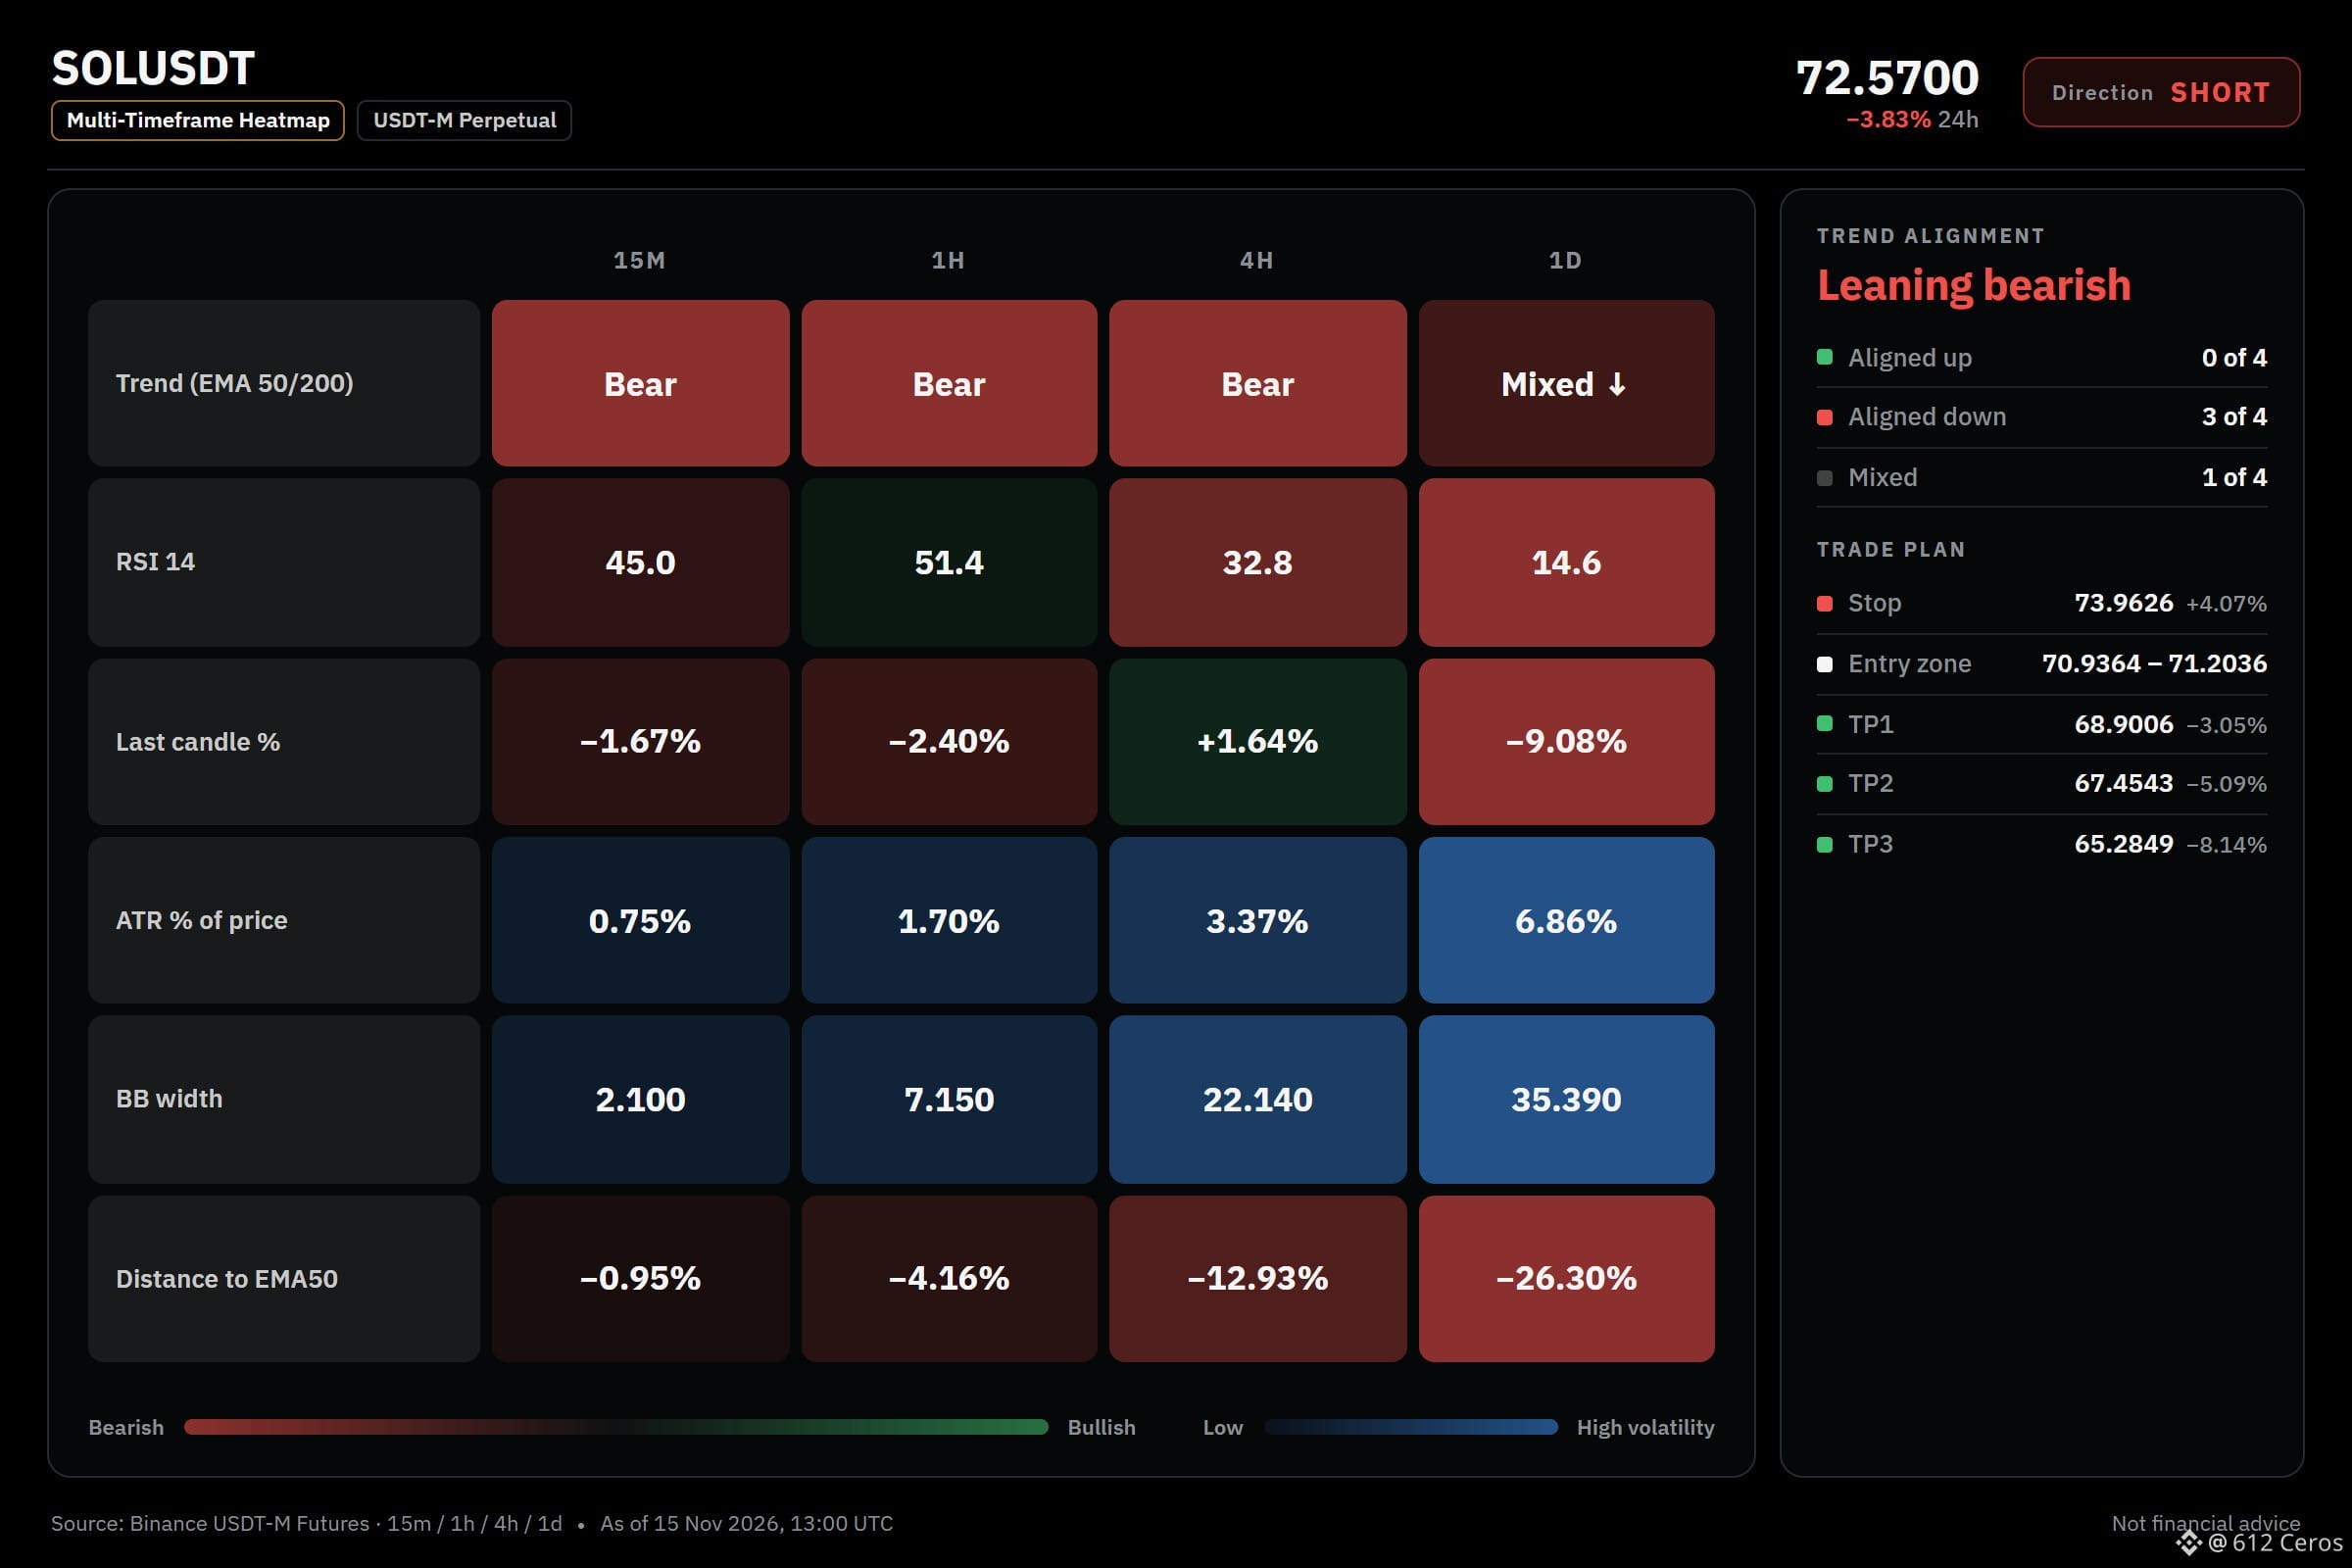
SOL is below EMA50 and EMA200 on the 4h chart, so the trend is down.
Entry: 70.9364 – 71.2036
TP1: 68.9006 (-3.1%)
TP2: 67.4543 (-5.1%)
TP3: 65.2849 (-8.1%)
SL: 73.9626 (+4.1%)
Why: The 4h price is below EMA50 and EMA200 in a bearish stack, meaning the swing trend is down.
Plan: close 50% at TP1, 25% at TP2, 25% at TP3, and move the stop to entry after TP1.
Where do you think SOL finds its next move from here?
⚠️ Personal market analysis only. NFA — manage risk and DYOR.
Educational content, not investment advice or a recommendation to buy, sell, deposit, or withdraw any asset. No paid promotion or referral/affiliate links.
SOL is below EMA50 and EMA200 on the 4h chart, so the trend is down.
Entry: 70.9364 – 71.2036
TP1: 68.9006 (-3.1%)
TP2: 67.4543 (-5.1%)
TP3: 65.2849 (-8.1%)
SL: 73.9626 (+4.1%)
Why: The 4h price is below EMA50 and EMA200 in a bearish stack, meaning the swing trend is down.
Plan: close 50% at TP1, 25% at TP2, 25% at TP3, and move the stop to entry after TP1.
Where do you think SOL finds its next move from here?
⚠️ Personal market analysis only. NFA — manage risk and DYOR.
Educational content, not investment advice or a recommendation to buy, sell, deposit, or withdraw any asset. No paid promotion or referral/affiliate links.