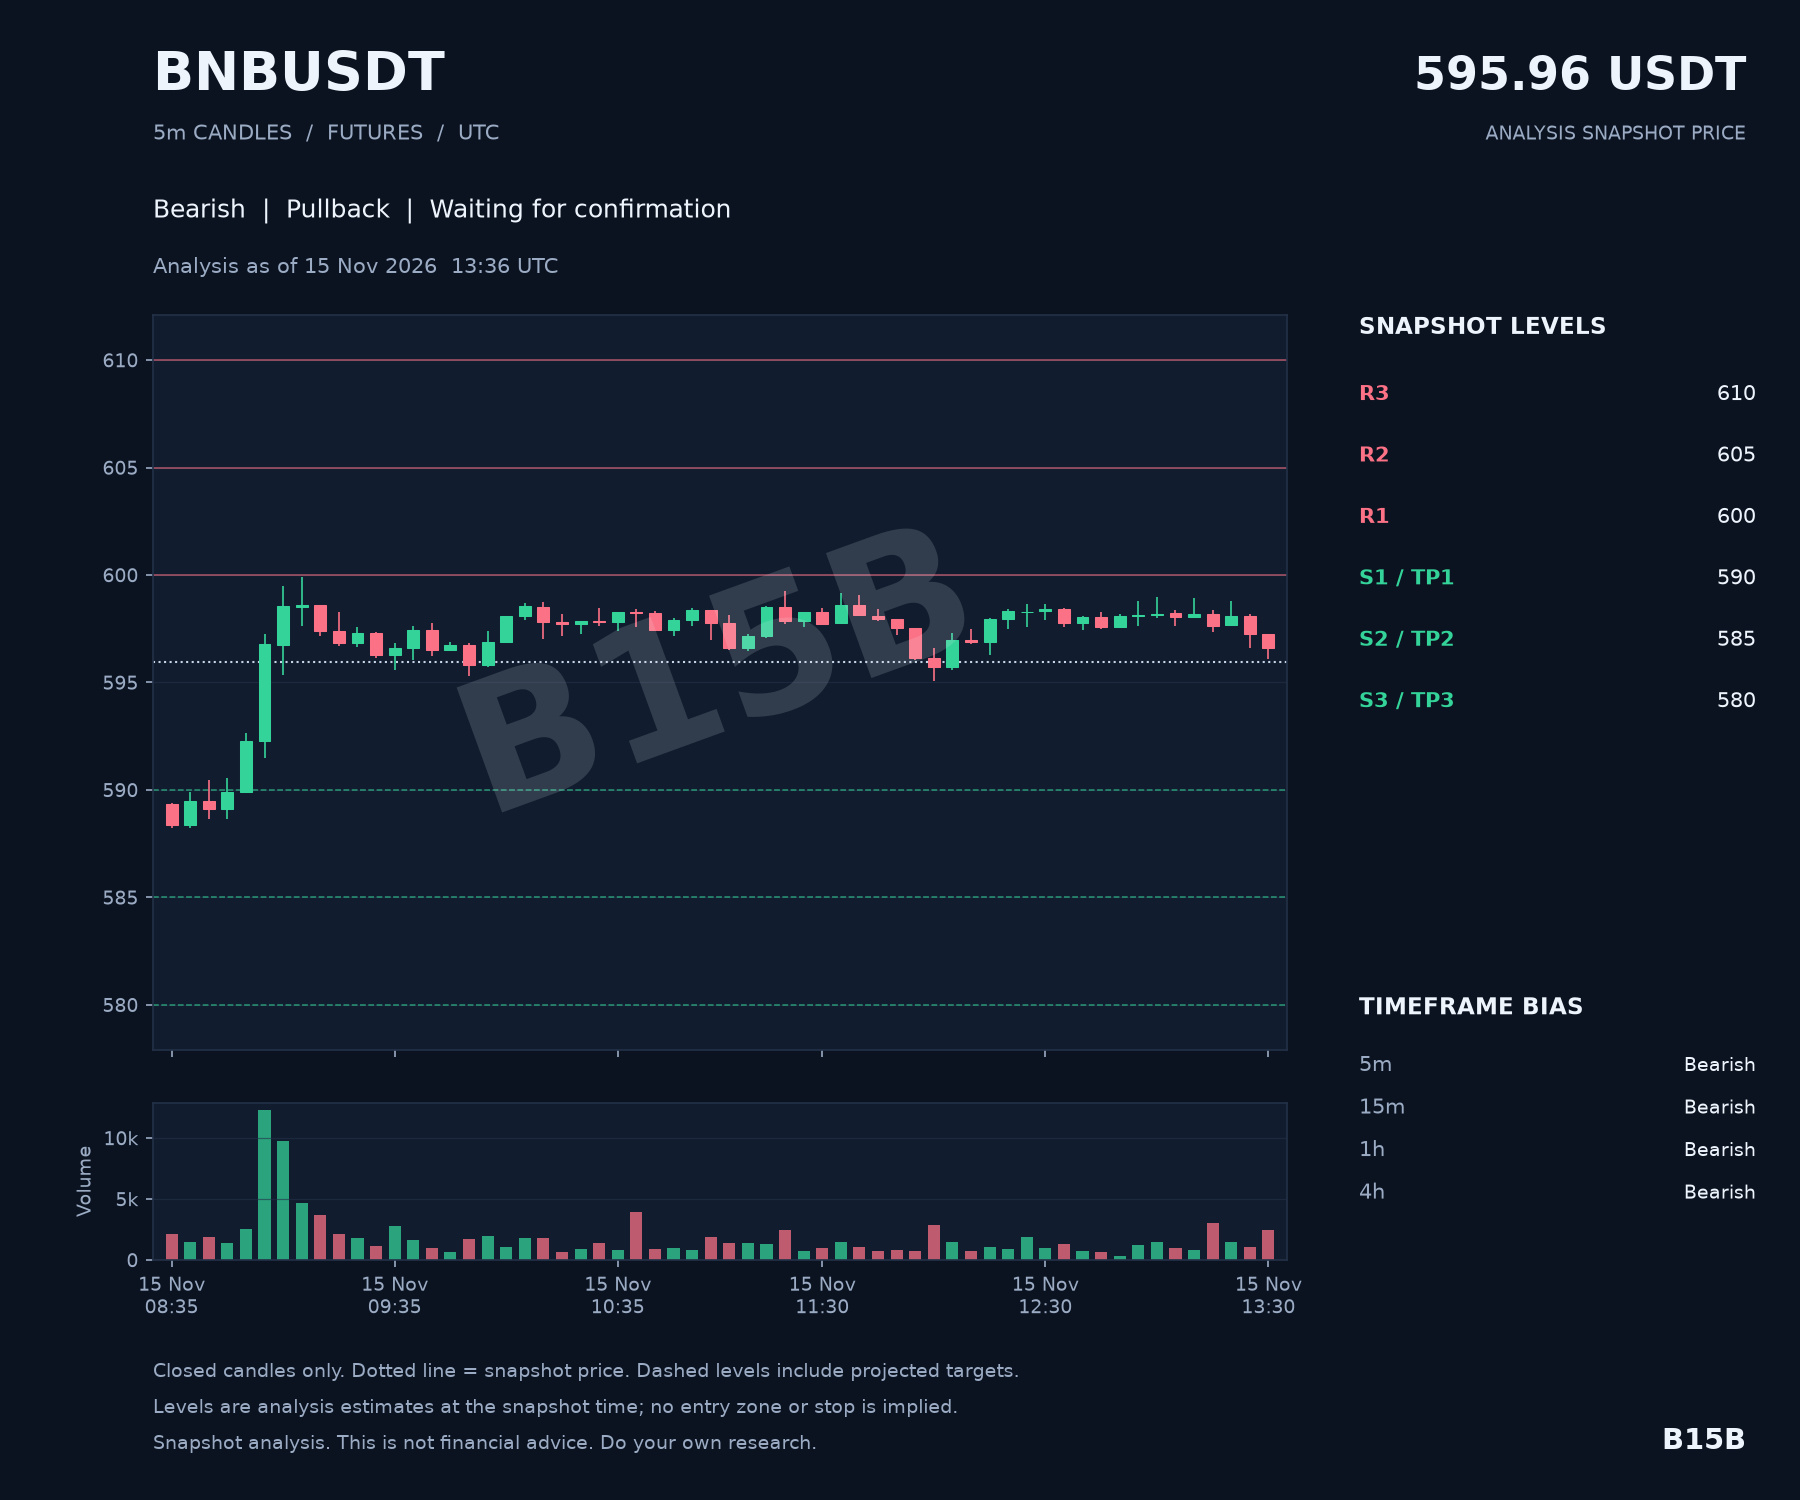
$BNB is looking heavy as it struggles to maintain its footing above the $600 mark. It is rare to see such a clean sweep of bearish sentiment, but currently, every timeframe from the 5-minute scalping charts up to the 4-hour trend is aligned in a downward trajectory.
The market is currently categorized as being in a "pullback" phase. While the macro trend is clearly leaning lower, we are seeing a momentary pause or retracement as the price hovers around $595.96. However, without a confirmed entry trigger to the upside, the path of least resistance remains tilted toward the established support levels below.
Looking at the immediate structure:
- 🚧 Resistance: Heavy selling pressure clustered at $600, $605, and $610.
- 🛡️ Support: Immediate downside targets sitting at $590, $585, and $580.
- 📉 Trend: Unanimous bearish alignment across 5m, 15m, 1h, and 4h timeframes.
Given that the entire technical stack—from micro-volatility to the 4-hour trend—is flashing bearish, what specific shift in price action or volume at the $600 resistance would you need to see to convince you that this is a bottoming formation rather than just a brief pause before a move toward $580? ⚠️
The $600 level is acting as a significant psychological and technical ceiling right now. Until $BNB can reclaim that handle with conviction, the bears seem content to control the narrative. Watch those support levels closely if the current pullback loses its steam. #BNB #CryptoAnalysis #TechnicalAnalysis
The market is currently categorized as being in a "pullback" phase. While the macro trend is clearly leaning lower, we are seeing a momentary pause or retracement as the price hovers around $595.96. However, without a confirmed entry trigger to the upside, the path of least resistance remains tilted toward the established support levels below.
Looking at the immediate structure:
- 🚧 Resistance: Heavy selling pressure clustered at $600, $605, and $610.
- 🛡️ Support: Immediate downside targets sitting at $590, $585, and $580.
- 📉 Trend: Unanimous bearish alignment across 5m, 15m, 1h, and 4h timeframes.
Given that the entire technical stack—from micro-volatility to the 4-hour trend—is flashing bearish, what specific shift in price action or volume at the $600 resistance would you need to see to convince you that this is a bottoming formation rather than just a brief pause before a move toward $580? ⚠️
The $600 level is acting as a significant psychological and technical ceiling right now. Until $BNB can reclaim that handle with conviction, the bears seem content to control the narrative. Watch those support levels closely if the current pullback loses its steam. #BNB #CryptoAnalysis #TechnicalAnalysis