

PART 1 — MARKET ANALYSIS (BTC/USDT Focus | Data as of Nov 15, 2026)
1. Global Macro
Inflation/Fed: October US PPI came in hot at +6.5% YoY, shifting market pricing toward a possible December Fed rate hike — a major risk-off driver for the Nov 13–14 selloff (Binance Research, via CoinStats, Nov 13).
Risk assets: The macro shock hit crypto in parallel with equities-sensitive assets; a hike-leaning Fed implies a firmer dollar environment, which historically caps risk-asset rallies (analytical inference, not a verified DXY print).
Geopolitics/regulation: US DOJ is pursuing $1.2B in stolen crypto tied to the Oct 29 Binance hack; the US Senate's Permanent Subcommittee on Investigations demanded Binance/Tether records by Jan 4, 2027; a FinCEN order takes effect Dec 10 (Binance to reject MEXC-linked transfers). Regulatory overhang = sustained caution.
2. Market Structure
Total crypto market cap: $2.18T, −4.29% in 24h (CoinMarketCap, Nov 15).
BTC dominance: 59.4% (ETH 10.0%) — BTC still absorbs most liquidity; altcoin season is off the table in this tape.
Sentiment: Fear & Greed fell from 21 (Nov 13) to 12/100 — Extreme Fear (Nov 15). In risk-off phases like this, capital typically rotates into stablecoins, lifting USDT dominance — a structural headwind for alts (general market mechanic, labeled as analysis).
3. Technicals (your 15m chart + verified price history)
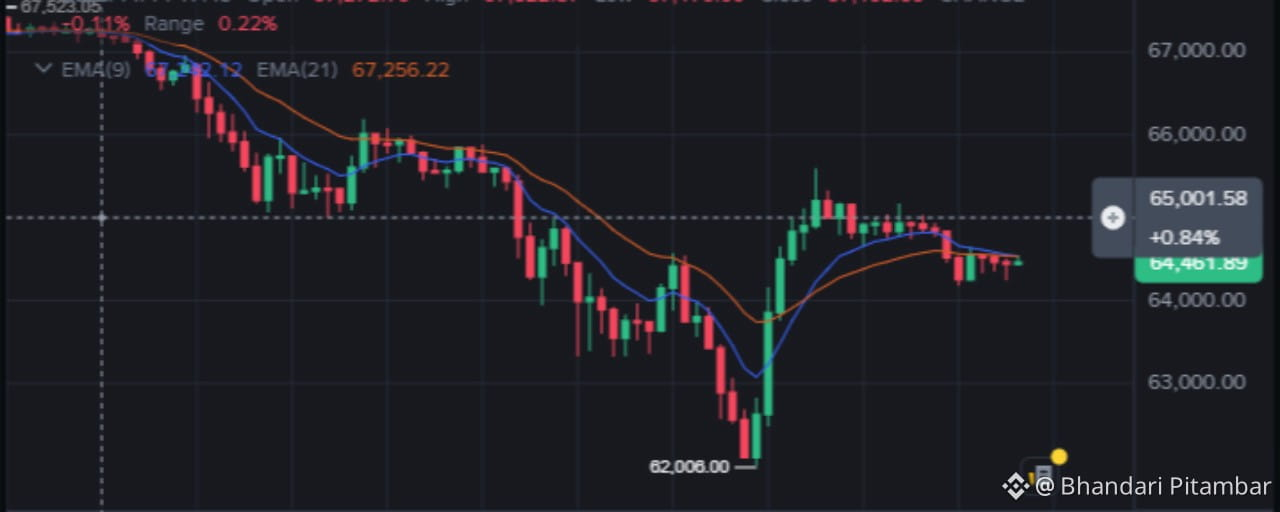
Price: $64,461.89 at your chart snapshot (Nov 14, 17:45), +0.84% on the bounce session. BTC broke below $69,000 on Nov 13 with a ~4.3% daily drop, tagged a 62,000.00 swing low, then V-bounced to ~65,500–65,800 and is now compressing.
15m: Price pinned between EMA(9) (~64,500) and a declining EMA(21); RSI(6) = 41.54 — neutral-weak, no momentum edge. Range compression after a V-bounce usually resolves with the higher-timeframe trend (currently down).
1H/4H: Relief bounce inside a descending structure; the bounce printed a lower high (~65,200s) after 65,800 — bears still control retries. A 4H close above 66,000 is the minimum needed to invalidate the immediate downtrend.
Daily: A −10% weekly impulse (69K → 62K) leaves short/mid moving averages stacked above price as dynamic resistance (structural inference from verified price path). Daily momentum is washed out; mean-reversion bounces are common here, but trend reversal requires reclaiming the 67,600 breakdown origin.
4. Futures & Positioning
Liquidations: >$1.9B market-wide in 24h (Nov 14); longs took ~89% of liquidations in major-coin samples (e.g., BNB: 88.7–89.1% longs) — this was a long flush, not a short attack.
Open interest: Falling OI alongside falling price (BNB sample: −4.74% in 2 days) indicates orderly long unwinding, not fresh short conviction — conditions that allow bounces but not reversals.
Funding: Near-neutral (BNB sample: +0.0034%/8h) — nobody is paying up for leverage; conviction is absent on both sides.
5. Whales, Institutions & ETFs
Spot Bitcoin ETFs: Continued outflows reported Nov 13 — institutional bid is absent exactly where it's needed.
Cross-check: VanEck's BNB ETF logged zero net flows for consecutive sessions — institutional caution is market-wide, not BTC-specific.
Whales: Distribution confirmed in alts (10M–100M ADA wallets sold ~50M ADA, Nov 4–10). For BTC, the dominant "whale" story is exchange-level: Binance fully replenished hack losses via SAFU/treasury and published a Proof-of-Reserves snapshot (Nov 12); the zero-knowledge proof verification was still computing (40–50h). An earlier reported $3.64B net outflow figure remains unverified — treat with caution.
6. News & Sentiment Calendar
Extreme Fear (12) + hack overhang + hot PPI = the three pillars of current bearish sentiment.
Upcoming catalysts: December FOMC (hike odds), Binance ZK-PoR verification result, Dec 10 FinCEN order, Jan 4 Senate records deadline.
🎯 PART 2 — FINAL ANALYSIS: BTC/USDT VERDICT
Horizon
Call
Triggers
Targets
Invalidation
Short-term (hrs–3d)
SIDEWAYS → mild pump leg
Hold 64,000; 15m/4H close above 65,800
66,500 → 67,000
Loss of 64,000
Medium-term (1–4w)
DUMP bias
Daily close < 62,000
60,000 psych; below = speculative air pocket toward high-50Ks (labeled speculation)
Daily close > 67,600
Trend flip (bullish)
PUMP
Daily close > 67,600
69,000 → 70,000
Fall back under 66,000
Key levels: Support 64,000 / 62,000 / 60,000 • Resistance 65,500–65,800 / 66,500–67,000 / 67,600 / 69,000.
Strongest major (relative): BNB — smallest drawdown Oct 9–Nov 7 (−5.6% vs SOL −18.5%, XRP −15.9%, Bittime Research), hack fully backstopped, tokenized-equity ecosystem leading ($1.5B bStocks).
Weakest major: ADA — −34.98%/30d, whale distribution, confidence headlines.
📰 PART 3 — BINANCE SQUARE ARTICLE (Ready to Publish)
🚨 Bitcoin at $64,400: Relief Bounce or Bear Trap? The $62,000 Line Decides Everything
The crypto market just lived through one of its most violent weeks of 2026. Bitcoin sliced below $69,000, liquidations exploded past $1.9 billion in 24 hours, and the Fear & Greed Index cratered to 12 — Extreme Fear. Now BTC is coiling at ~$64,460 after a textbook V-bounce off $62,000. The question every trader is asking: is this the bottom, or just fuel for the next leg down?
🌍 Market Overview: Macro Is Driving the Tape
October's US PPI print of +6.5% YoY resurrected something traders never expected to price in late in the cycle: odds of a December Fed rate hike. Add continued spot Bitcoin ETF outflows, a total market cap bleeding to $2.18T (−4.29% in 24h), and BTC dominance pinned at 59.4%, and you have a market where safety outranks speculation. Altseason? Not in this climate.
📉 Bitcoin Technicals: The Battle Map
15-minute chart: After tagging 62,000.00, BTC printed a V-recovery to ~65,800 and is now compressing between its short-term EMAs with RSI(6) at ~41.5 — a market waiting for a catalyst, not a trend.
4-hour chart: The bounce already printed a lower high. Until BTC closes above 66,000, every rally is statistically a guest in a bearish house.
Daily chart: The 69K→62K impulse left moving averages stacked overhead. The 67,600 breakdown origin is the line that separates "bounce" from "reversal."
Key levels:
🟢 Support: 64,000 → 62,000 → 60,000
🔴 Resistance: 65,500–65,800 → 66,500–67,000 → 67,600 → 69,000
🐂 Bullish vs 🐻 Bearish Scenarios
🐂 The Pump Case: 64,000 holds, 65,800 falls with volume → targets 66,500–67,000. A daily close above 67,600 flips structure and opens 69,000–70,000. Oversold conditions + exhausted longs (funding near neutral) are classic bounce fuel.
🐻 The Dump Case: Lose 64,000 and the market retests 62,000. A daily close below it exposes the 60,000 psychological floor — and below that, thin liquidity (speculative zone). With ETF outflows ongoing and a hike-leaning Fed, rallies keep meeting sellers.
🐋 Whale & Institutional Tape
The Nov 13–14 flush was a long liquidation event (~89% of liquidated positions were longs) with falling open interest — an orderly deleveraging, not a short ambush. That distinction matters: deleveraged markets bounce harder, but they don't reverse without institutional demand, and spot ETF flows are still negative. Meanwhile, Binance's post-hack Proof-of-Reserves snapshot and completed SAFU replenishment removed one systemic fear — verification of the ZK proof remains the next trust milestone to watch.
🔭 Alt Radar: Who's Strong, Who's Weak
Strongest: BNB — outperformed every major from Oct 9–Nov 7 (−5.6% vs SOL −18.5%, XRP −15.9%), with a fully backstopped exchange balance sheet and a tokenized-equity ecosystem crossing $1.5B.
Weakest: ADA — down ~35% in 30 days, hit by whale distribution (~50M ADA sold Nov 4–10) and shaky holder confidence.
🔮 Final Prediction
Short term: sideways-to-up inside a 62,000–66,000 range — a deleveraged bounce in progress.
Medium term: bearish until proven otherwise. 67,600 is the verdict level. Below it, rallies are for trading, not marrying. Below 62,000, the trend resumes with 60,000 in sight.
Extreme Fear readings like 12 have historically marked zones of opportunity — but only for those who wait for confirmation, not those who guess bottoms.
💬 Conclusion
This market isn't paying the brave; it's paying the patient. Watch 64,000 for the day-trade, 66,000 for the swing, and 67,600 for the trend. Manage risk like your portfolio depends on it — because right now, it does.
Not financial advice. Do your own research.
#Bitcoin #BTC #CryptoMarket #TechnicalAnalysis #Fed #WhaleWatch #BinanceSquare #BTCUSDT

