DAILY SIGNAL — SOL/USDT
Date: 15 Nov 2026
Chart Time: 02:23 UTC+8
Timeframe: 1m
Intraday Bias: Bearish continuation → weak-low support test
---
📊 MARKET BIAS
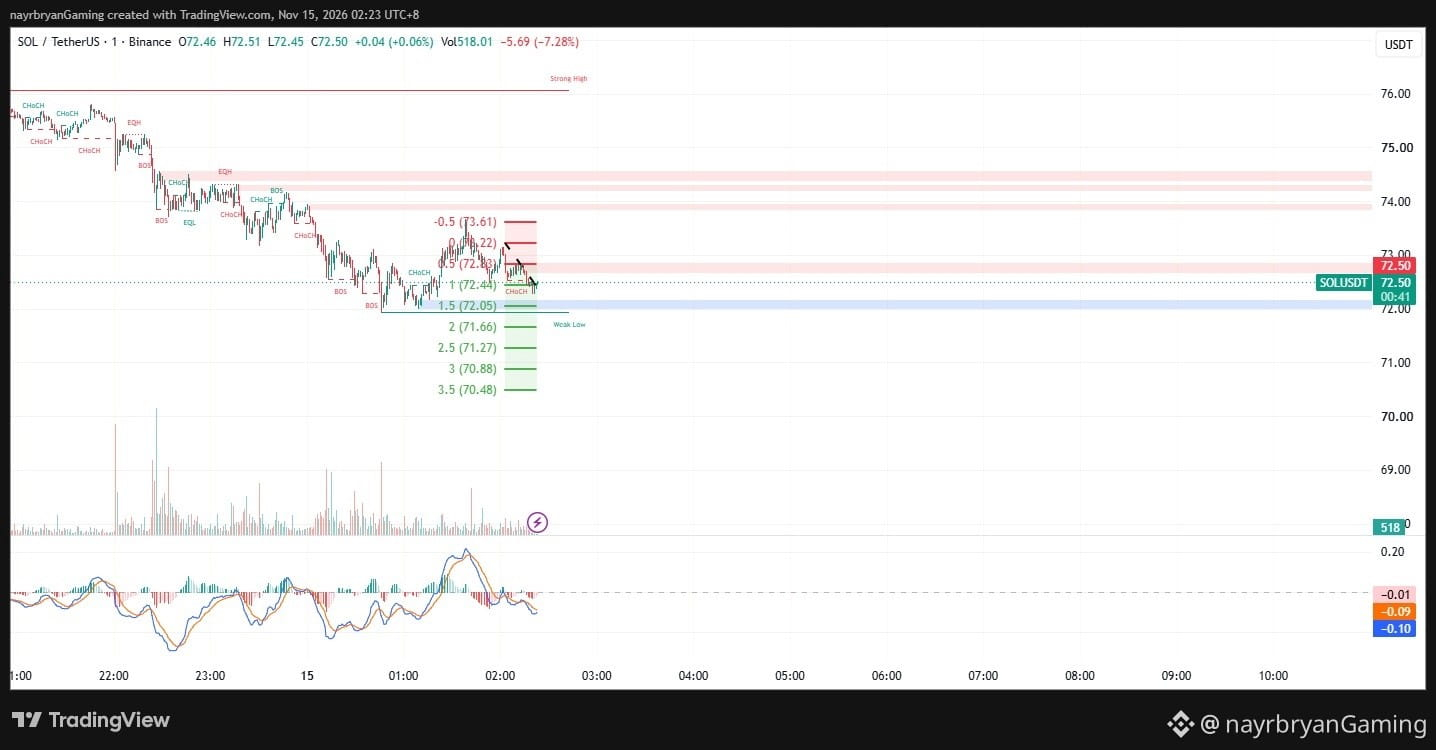
SOL continues to display a bearish short-term market structure after a sustained decline from the 76.00 area.
Price is currently trading around 72.50, following a temporary recovery from the lower support region.
Despite the recent bounce, the broader structure continues to show lower highs and persistent selling pressure.
The immediate resistance area around 72.70–72.85 is important for determining whether the recovery can continue or sellers regain control.
Meanwhile, the marked weak-low area around 72.05–71.66 represents an important downside liquidity reference.
A confirmed breakdown could expose the lower Fibonacci extensions toward 71.27 → 70.88 → 70.48.
However, a successful reclaim of nearby resistance could produce a short-term recovery.
---
🔹 KEY LEVELS FROM CHART
Current Price:
72.50
Immediate Resistance:
72.70–72.83
Upper Resistance:
73.22
Major Resistance:
73.61
Weak-Low / Support Reference:
72.05–71.66
Lower Support:
71.27
Extended Downside Levels:
70.88–70.48
---
🎯 FIBONACCI LEVELS
Chart Fibonacci References:
0.0 → 73.22
0.5 → 72.83
1.0 → 72.44
1.5 → 72.05
2.0 → 71.66
2.5 → 71.27
3.0 → 70.88
3.5 → 70.48
Upper Reference:
-0.5 → 73.61
Potential Downside Extensions:
TP1 → 72.05 (1.5 Fib)
TP2 → 71.66 (2.0 Fib)
TP3 → 71.27 (2.5 Fib)
TP4 → 70.88 (3.0 Fib)
TP5 → 70.48 (3.5 Fib)
These are conditional technical reference levels, not guaranteed targets.
---
🧠 QUICK INSIGHT
"After a prolonged decline, the first bounce is not necessarily a reversal. Confirmation determines the difference."
---
⚠️ DISCLAIMER
This is personal market analysis, not financial advice.
This chart framework is for educational purposes only.
Always DYOR / DYODD, manage risk properly, and avoid emotional trading.
— @nayrbryanGaming
#SOL #SOLUSDT #Crypto #Trading #TechnicalAnalysis #PriceAction #SmartMoney #Fibonacci #Binance #MACD #DYOR #NFA #NoFOMO
Date: 15 Nov 2026
Chart Time: 02:23 UTC+8
Timeframe: 1m
Intraday Bias: Bearish continuation → weak-low support test
---
📊 MARKET BIAS
SOL continues to display a bearish short-term market structure after a sustained decline from the 76.00 area.
Price is currently trading around 72.50, following a temporary recovery from the lower support region.
Despite the recent bounce, the broader structure continues to show lower highs and persistent selling pressure.
The immediate resistance area around 72.70–72.85 is important for determining whether the recovery can continue or sellers regain control.
Meanwhile, the marked weak-low area around 72.05–71.66 represents an important downside liquidity reference.
A confirmed breakdown could expose the lower Fibonacci extensions toward 71.27 → 70.88 → 70.48.
However, a successful reclaim of nearby resistance could produce a short-term recovery.
---
🔹 KEY LEVELS FROM CHART
Current Price:
72.50
Immediate Resistance:
72.70–72.83
Upper Resistance:
73.22
Major Resistance:
73.61
Weak-Low / Support Reference:
72.05–71.66
Lower Support:
71.27
Extended Downside Levels:
70.88–70.48
---
🎯 FIBONACCI LEVELS
Chart Fibonacci References:
0.0 → 73.22
0.5 → 72.83
1.0 → 72.44
1.5 → 72.05
2.0 → 71.66
2.5 → 71.27
3.0 → 70.88
3.5 → 70.48
Upper Reference:
-0.5 → 73.61
Potential Downside Extensions:
TP1 → 72.05 (1.5 Fib)
TP2 → 71.66 (2.0 Fib)
TP3 → 71.27 (2.5 Fib)
TP4 → 70.88 (3.0 Fib)
TP5 → 70.48 (3.5 Fib)
These are conditional technical reference levels, not guaranteed targets.
---
🧠 QUICK INSIGHT
"After a prolonged decline, the first bounce is not necessarily a reversal. Confirmation determines the difference."
---
⚠️ DISCLAIMER
This is personal market analysis, not financial advice.
This chart framework is for educational purposes only.
Always DYOR / DYODD, manage risk properly, and avoid emotional trading.
— @nayrbryanGaming
#SOL #SOLUSDT #Crypto #Trading #TechnicalAnalysis #PriceAction #SmartMoney #Fibonacci #Binance #MACD #DYOR #NFA #NoFOMO