

Bitcoin ($BTC /USD) – Complete Technical & Fundamental Analysis 14 November 2026
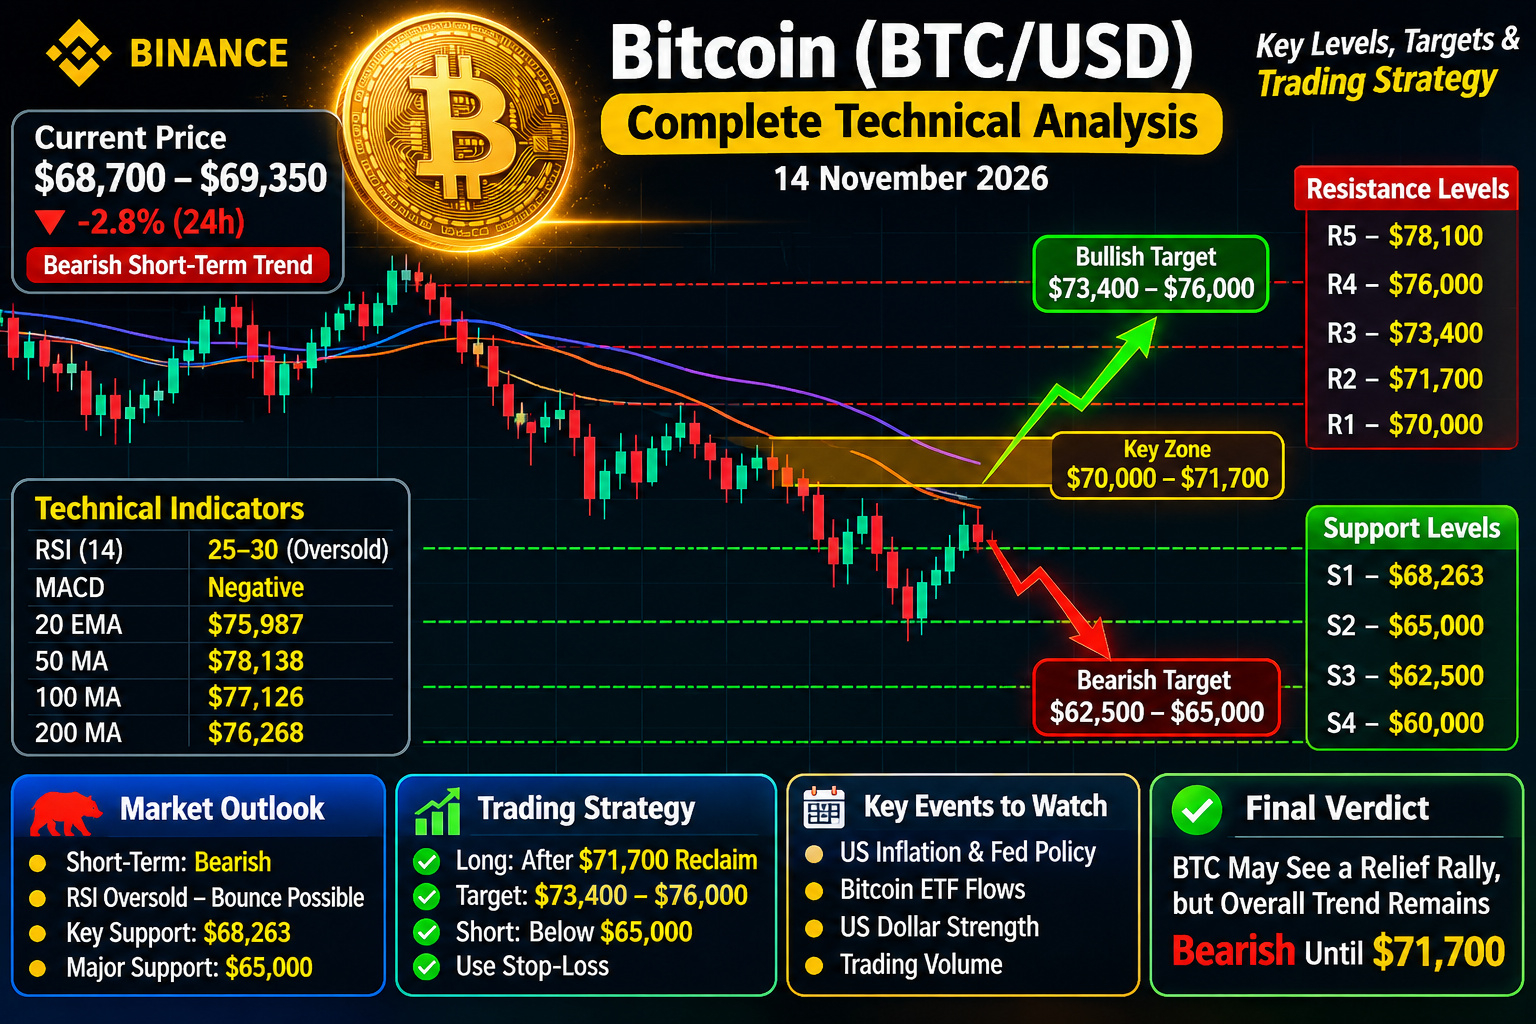
Trading analysis
Bitcoin is the leading cryptocurrency and the overall direction of BTC often influences the entire crypto market, including ETH, SOL, XRP, BNB and other Binance-listed coins.

This analysis covers market direction, technical indicators, support and resistance, bullish and bearish scenarios, and trading strategies.
### 1\. Current $BTC market situation
Bearish short-term trend
Latest reported market price · USD
### $68,700–$69,350
Significant selling pressure
Key psychological level
$70,000
Short-term direction
Downtrend
Daily RSI
29.5–25.2
Market condition
Oversold
Indicative reported prices, not a verified live Binance quote. Sources report different timestamps and exchanges. The Wall Street Journal +2
What is happening?
* Bitcoin has fallen below $70,000.
* The market has experienced several consecutive losing weeks.
* Sellers are controlling the short-term trend.
* RSI is in oversold territory, so a relief bounce is possible.
* An oversold RSI does not automatically mean a bottom has formed.
The Wall Street Journal +1
### 2\. Technical analysis
| Indicator | Current reading | Interpretation |
| ---------- | --------------- | ---------------- |
| RSI (14) | 25–30 | Oversold |
| MACD | Negative | Bearish momentum |
| 20-day EMA | $75,987 | Resistance |
| 50-day MA | $78,138 | Resistance |
| 100-day MA | $77,126 | Resistance |
| 200-day MA | $76,268 | Resistance |
The daily and four-hour structures show lower highs and lower lows. The price is below all the listed moving averages, confirming bearish technical conditions. Coin Edition +1
### 3\. Important support levels
These are the key downside levels to monitor.
| Support | Price (USD) | Importance |
| ------- | ----------- | --------------------------- |
| S1 | $68,263 | Immediate support |
| S2 | $65,000 | Major psychological support |
| S3 | $62,500 | Deeper downside target |
| S4 | $60,000 | Psychological support |
My interpretation:
* If BTC holds $68,263, a recovery attempt is possible.
* If BTC loses $65,000 on a daily closing basis, $62,500 becomes important.
* If $62,500 breaks decisively, selling pressure could increase further.
Coin Edition +1
### 4\. Important resistance levels
| Resistance | Price (USD) | Importance |
| ---------- | ----------- | ------------------------- |
| R1 | $70,000 | First resistance |
| R2 | $71,700 | Trendline resistance |
| R3 | $73,400 | Major resistance |
| R4 | $76,000 | Moving average zone |
| R5 | $78,100 | Stronger recovery barrier |
Bullish confirmation: $BTC needs to reclaim $70,000 and then $71,700. A sustained move above $73,400 would provide stronger evidence of recovery. Coin Edition +1
US spot Bitcoin ETFs recorded approximately $1.44 billion in net outflows over five trading sessions through November 11. This indicates weaker institutional demand through that channel. Goodman Macro
Strong US dollar
A stronger dollar and expectations of higher interest rates are putting pressure on risk assets, including Bitcoin. The Wall Street Journal +1
Market liquidity
Stablecoin supply reportedly declined by approximately 4.85% over 30 days, suggesting weaker available crypto-market liquidity. Goodman Macro
Overall fundamental outlook: bearish in the short term, with recovery dependent on renewed spot demand and improving liquidity.
### 6\. Three possible BTC price scenarios
Bullish scenario
Recovery
### $71,700 → $73,400
BTC reclaims $70,000, breaks $71,700 and holds above it. The next recovery target is $73,400, followed by $76,000.
Bearish scenario
Higher downside risk
### $65,000 → $62,500
BTC fails to recover $70,000 and breaks below $68,263. A daily close below $65,000 would increase downside risk.
Sideways scenario
Consolidation
### $68,000–$70,000
Buyers and sellers struggle for control, creating a temporary trading range.
These are conditional scenarios, not guaranteed price predictions.
### 7\. Trading strategy for Binance
| Strategy | Entry condition | Target | Risk |
| ----------------- | ----------------------------- | --------------- | --------------------------------------- |
| Conservative long | Daily reclaim of $71,700 | $73,400–$76,000 | Stop below confirmed setup invalidation |
| Support bounce | Bullish reversal near $68,263 | $70,000 | Tight risk control |
| Breakdown short | Confirmed break below $65,000 | $62,500 | Stop above breakdown level |
| No trade | Price moves sideways | Wait | Avoid overtrading |
My trading recommendation: Avoid aggressive long positions while BTC remains below $70,000–$71,700. Wait for confirmation rather than buying simply because RSI is oversold.
For futures, use low leverage and define your stop-loss before entering.
### 8\. Important events to watch
* US inflation and Federal Reserve interest-rate expectations.
* Bitcoin ETF daily inflows and outflows.
* US dollar strength.
* BTC trading volume.
* Binance futures funding rates and open interest.
* Daily candle closing above or below $70,000.
### 9\. Final BTC/USD outlook
### Short-term: Bearish
Sellers currently have control
Next important support: $68,263
Major support: $65,000
First recovery resistance: $70,000
Bullish confirmation: $71,700–$73,400
Overall view: Bitcoin may experience a relief rally because RSI is oversold, but the broader short-term structure remains bearish until major resistance levels are recovered.
Disclaimer: This is educational market analysis, not financial advice. Prices and technica
l indicators change continuously. Verify live Binance prices before trading.
I can also create a professional Bitcoin BTC/USD trading analysis image showing bullish and bearish targets, support, resistance and entry zones.
#BTC走势分析 #BTCanalysis #BTCUSDTAnalysis #TrendingPredictions #viralpost