Market Overview
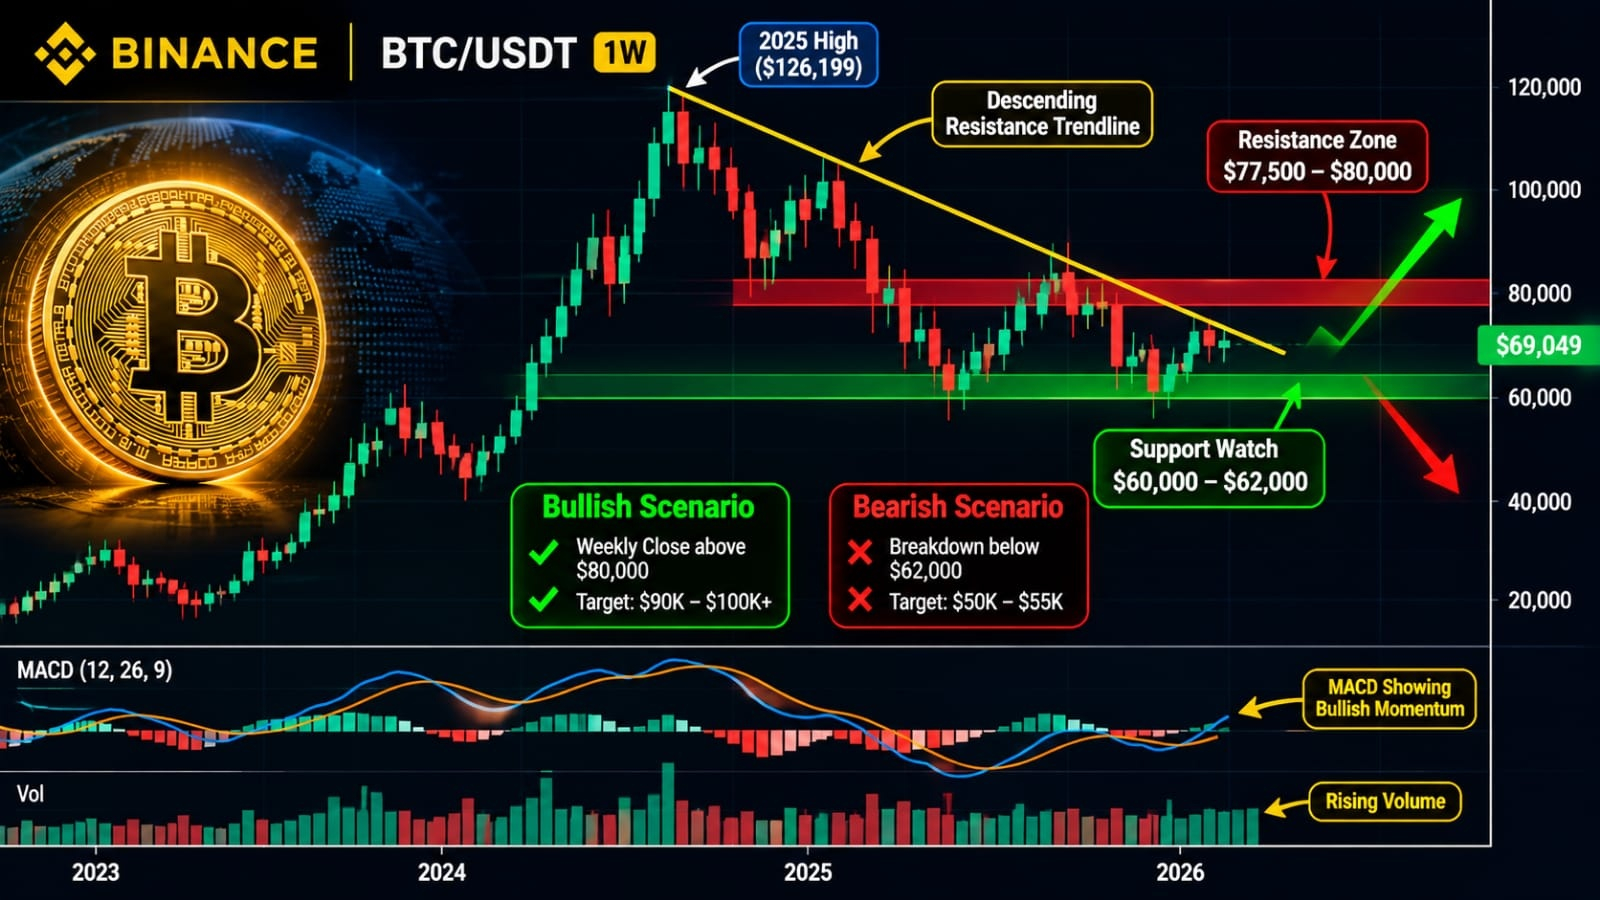
Bitcoin (BTC) is currently trading around $69,049 in the chart snapshot, while the weekly timeframe shows an important battle between buyers and sellers.
The market is still facing a major descending resistance trendline from the 2025 high. This trendline could play a crucial role in determining Bitcoin's next major move.
The key question is: Will Bitcoin break above resistance and start a new bullish rally, or will sellers push the price toward lower support levels?
Let's examine the technical picture.
1. Major Resistance Zone: $77,500–$80,000
The $77,500–$80,000 region is an important resistance area.
Bitcoin has previously struggled around this zone, making it a critical level for bullish traders.
A strong weekly candle close above $80,000, supported by increasing trading volume, could indicate a potential breakout.
If this happens, the next upside targets to monitor could be:
- $90,000
- $100,000
- Above $100,000, depending on market momentum.
However, a simple move above resistance is not enough. Confirmation through a strong weekly close and a successful retest would make the breakout more convincing.
2. Important Support Zone: $60,000–$62,000
On the downside, $60,000–$62,000 is an important support area to watch.
If Bitcoin experiences selling pressure and moves toward this region, buyers may attempt to defend the support.
A strong reaction from this zone could create an opportunity for a potential recovery.
However, if Bitcoin breaks below $60,000 with strong selling volume, the bearish outlook could become stronger.
Possible downside levels to monitor would be:
- $55,000
- $50,000
These are potential technical reference levels, not guaranteed price targets.
3. MACD and Volume Analysis
The MACD indicator in the chart suggests improving bullish momentum.
The histogram and moving-average lines should be monitored for confirmation of a stronger trend reversal.
Trading volume is equally important.
A breakout supported by rising volume would generally be more reliable than a breakout occurring with weak participation.
If volume decreases during an upward move, traders should remain cautious about a possible false breakout.
4. Bullish Scenario
Bitcoin could gain stronger bullish momentum if:
- BTC breaks above the descending resistance trendline.
- The weekly candle closes above $80,000.
- Trading volume increases during the breakout.
- The MACD confirms improving bullish momentum.
If these conditions align, Bitcoin could potentially move toward $90,000 and $100,000 or higher.
5. Bearish Scenario
The bearish scenario becomes more relevant if:
- Bitcoin fails to break the descending resistance.
- Sellers push the price below the $60,000–$62,000 support zone.
- Selling volume increases.
- MACD momentum turns bearish.
Under these conditions, Bitcoin could potentially revisit $55,000 or $50,000.
Final Thoughts
Bitcoin is approaching an important technical decision zone.
The $77,500–$80,000 resistance area and the $60,000–$62,000 support area are two key regions worth monitoring.
Rather than predicting the market based on emotions, traders should wait for confirmation from weekly candle closes, volume, and momentum indicators.
My strategy: Stay patient, monitor the resistance and support levels, and avoid entering trades without proper confirmation and risk management.
The next major move could depend on how Bitcoin reacts around these important technical levels.
What do you think?
Will BTC break above $80,000 and start a new bullish rally, or will the market experience another correction?
Share your analysis in the comments!
$BTC #BTC #CryptoAnalysis #TechnicalAnalysis #BinanceSquar #BTCUSD