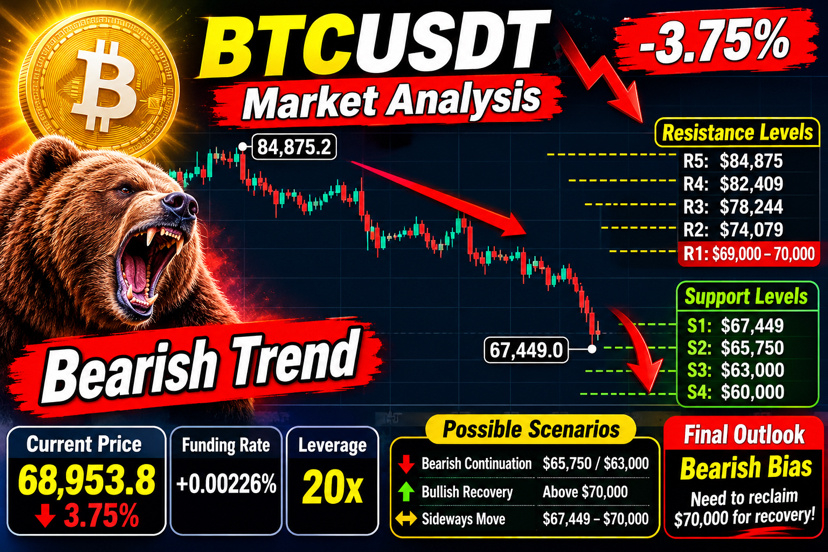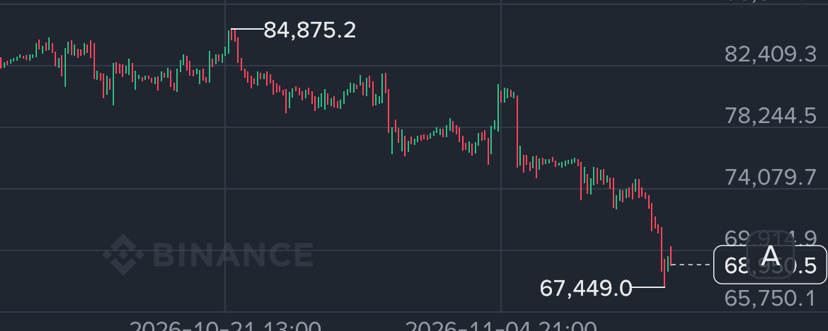

Based on your Binance Futures screenshot, BTCUSDT is showing strong bearish momentum on the 4-hour timeframe. The market has experienced a significant decline, and buyers have not yet demonstrated enough strength to confirm a trend reversal.
1. Current Market Overview
BTC/USDT Perpetual
-3.75%
68,953.8 USDT
Approximate price shown in your screenshot
Recent chart high
84,875.2
Recent chart low
67,449.0
Funding rate
+0.00226%
Timeframe
4 Hours
2. Technical Analysis
Trend direction: Bearish
There are three important signals on this chart:
Lower Highs: Bitcoin continues making lower highs, showing weakening buying pressure.
Lower Lows: The price is making lower lows, confirming the broader downward structure.
Selling Pressure: Strong downward candles indicate that sellers have controlled much of the recent price movement.
Bitcoin has fallen from approximately $84,875 to $67,449, a decline of around 20.5%.
3. Important Support Levels
These are the important price areas visible or suggested by the chart.
Support
Price
S1
$67,449
S2
$65,750
S3
$63,000
S4
$60,000
Important: $67,449 is the recent visible low. If BTC breaks below this area and a 4-hour candle closes beneath it, further weakness could develop.
4. Important Resistance Levels
Resistance
Price
R1
$69,000–70,000
R2
$74,079
R3
$78,244
R4
$82,409
R5
$84,875
The $69,000–70,000 region is the first important area buyers need to reclaim.
5. Possible Market Scenarios
Scenario 1: Bearish continuation
Bearish
If BTC fails to recover above $70,000 and breaks below $67,449, the next areas to watch are $65,750 and $63,000.
Scenario 2: Bullish recovery
Bullish
If buyers defend $67,449 and BTC reclaims $70,000 with strong 4-hour candles, a recovery toward $74,079 becomes possible.
Scenario 3: Sideways movement
Neutral
BTC could consolidate between approximately $67,449 and $70,000 before choosing its next direction.
6. Order Book Analysis
Your screenshot shows:
Red orders above the current market price.
Green orders below the current market price.
A relatively large visible sell order around $68,903.4.
A visible buy order around $68,903.3.
This is only a snapshot of the order book. Orders can change or disappear, so it cannot independently confirm market direction.
7. Futures Market Risk
Your screenshot also shows 20x leverage.
High leverage increases the risk of rapid losses. A relatively small adverse price movement can have a significant impact on a futures position. It is important not to treat this chart analysis as a guaranteed trading signal.
8. Final Market Outlook
Bearish Bias
The 4-hour chart currently favors sellers.
Immediate support: $67,449
Important resistance: $70,000
Further downside area: $65,750
Recovery confirmation: Strong 4-hour close above $70,000
My technical conclusion: BTC needs to regain important resistance levels before a bullish reversal can be considered more convincing. Until then, the overall chart structure remains bearish.
One limitation: Your screenshot does not include RSI, MACD, moving averages or trading volume, so those indicators cannot be confirmed.
You can share an updated BTCUSDT chart with RSI and MACD visible, and I can provide a more complete technical analysis in English.
#WhatWillDriveCryptoandStocks’NextRebound? #BitcoinBreaksBelow200WeekMovingAverage