BTC Weekly Analysis: Is Bitcoin Heading Toward $60K?
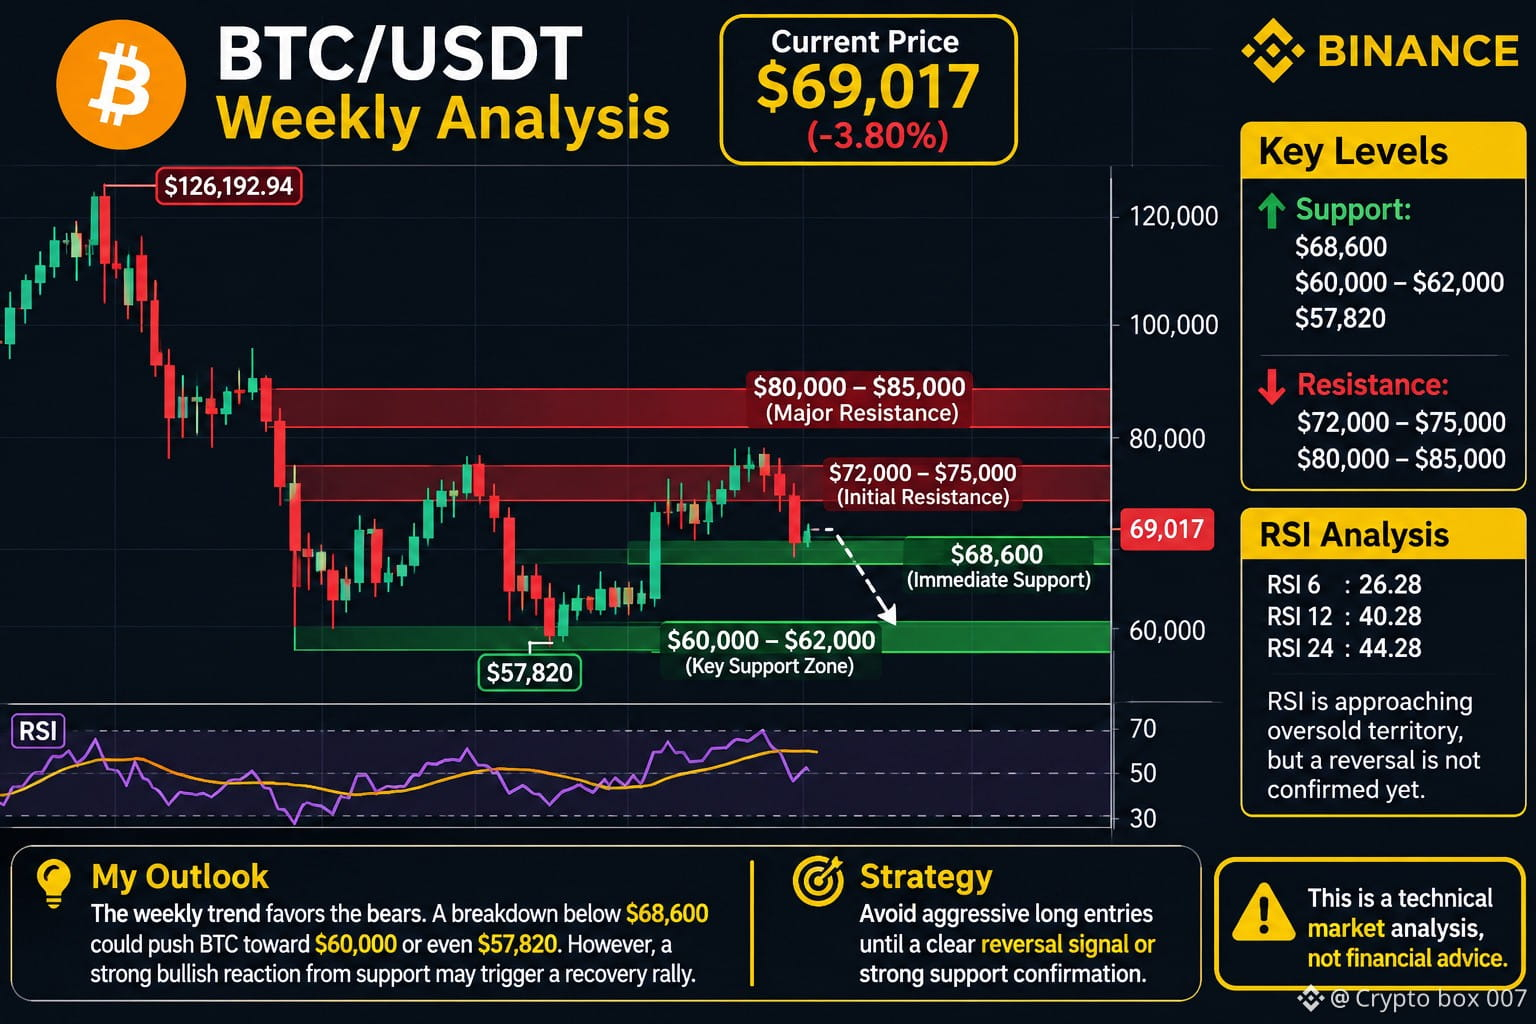
Bitcoin is currently trading around $69,017, showing significant bearish pressure on the weekly timeframe.
1. Market Structure
BTC has faced strong rejection from the $84,000–$85,000 resistance area. The recent weekly candles indicate continued selling pressure, with lower highs suggesting that sellers remain in control.
2. Key Support Levels
$68,600: Immediate support.
$60,000–$62,000: Important psychological and technical support zone.
$57,820: Major previous swing low.
A breakdown below $68,600 could increase the probability of a move toward $60K.
3. Key Resistance Levels
$72,000–$75,000: Initial resistance.
$80,000–$85,000: Major resistance zone.
BTC needs a strong weekly recovery above these levels to improve its bullish outlook.
4. RSI Analysis
Weekly RSI readings:
RSI 6: 26.28
RSI 12: 40.28
RSI 24: 44.28
The short-term RSI is approaching oversold territory, indicating strong bearish momentum. However, an oversold RSI alone does not confirm a reversal.
My Outlook
The weekly trend currently favors the bears. If BTC loses the $68,600 support, a deeper correction toward $60,000 or even the previous low near $57,820 becomes possible.
However, a strong bullish reaction from support could trigger a relief rally.
Strategy: Avoid aggressive long entries until a clear reversal signal or strong support confirmation appears.
This is a technical market analysis, not financial advice.
#BTC #bitcoin #CryptoAnalysis #BTCUSDT #BinanceSquare $BTC
Bitcoin is currently trading around $69,017, showing significant bearish pressure on the weekly timeframe.
1. Market Structure
BTC has faced strong rejection from the $84,000–$85,000 resistance area. The recent weekly candles indicate continued selling pressure, with lower highs suggesting that sellers remain in control.
2. Key Support Levels
$68,600: Immediate support.
$60,000–$62,000: Important psychological and technical support zone.
$57,820: Major previous swing low.
A breakdown below $68,600 could increase the probability of a move toward $60K.
3. Key Resistance Levels
$72,000–$75,000: Initial resistance.
$80,000–$85,000: Major resistance zone.
BTC needs a strong weekly recovery above these levels to improve its bullish outlook.
4. RSI Analysis
Weekly RSI readings:
RSI 6: 26.28
RSI 12: 40.28
RSI 24: 44.28
The short-term RSI is approaching oversold territory, indicating strong bearish momentum. However, an oversold RSI alone does not confirm a reversal.
My Outlook
The weekly trend currently favors the bears. If BTC loses the $68,600 support, a deeper correction toward $60,000 or even the previous low near $57,820 becomes possible.
However, a strong bullish reaction from support could trigger a relief rally.
Strategy: Avoid aggressive long entries until a clear reversal signal or strong support confirmation appears.
This is a technical market analysis, not financial advice.
#BTC #bitcoin #CryptoAnalysis #BTCUSDT #BinanceSquare $BTC