
$OSMO /USDT — Buyers Just Woke Up! Is Another Rally Coming?
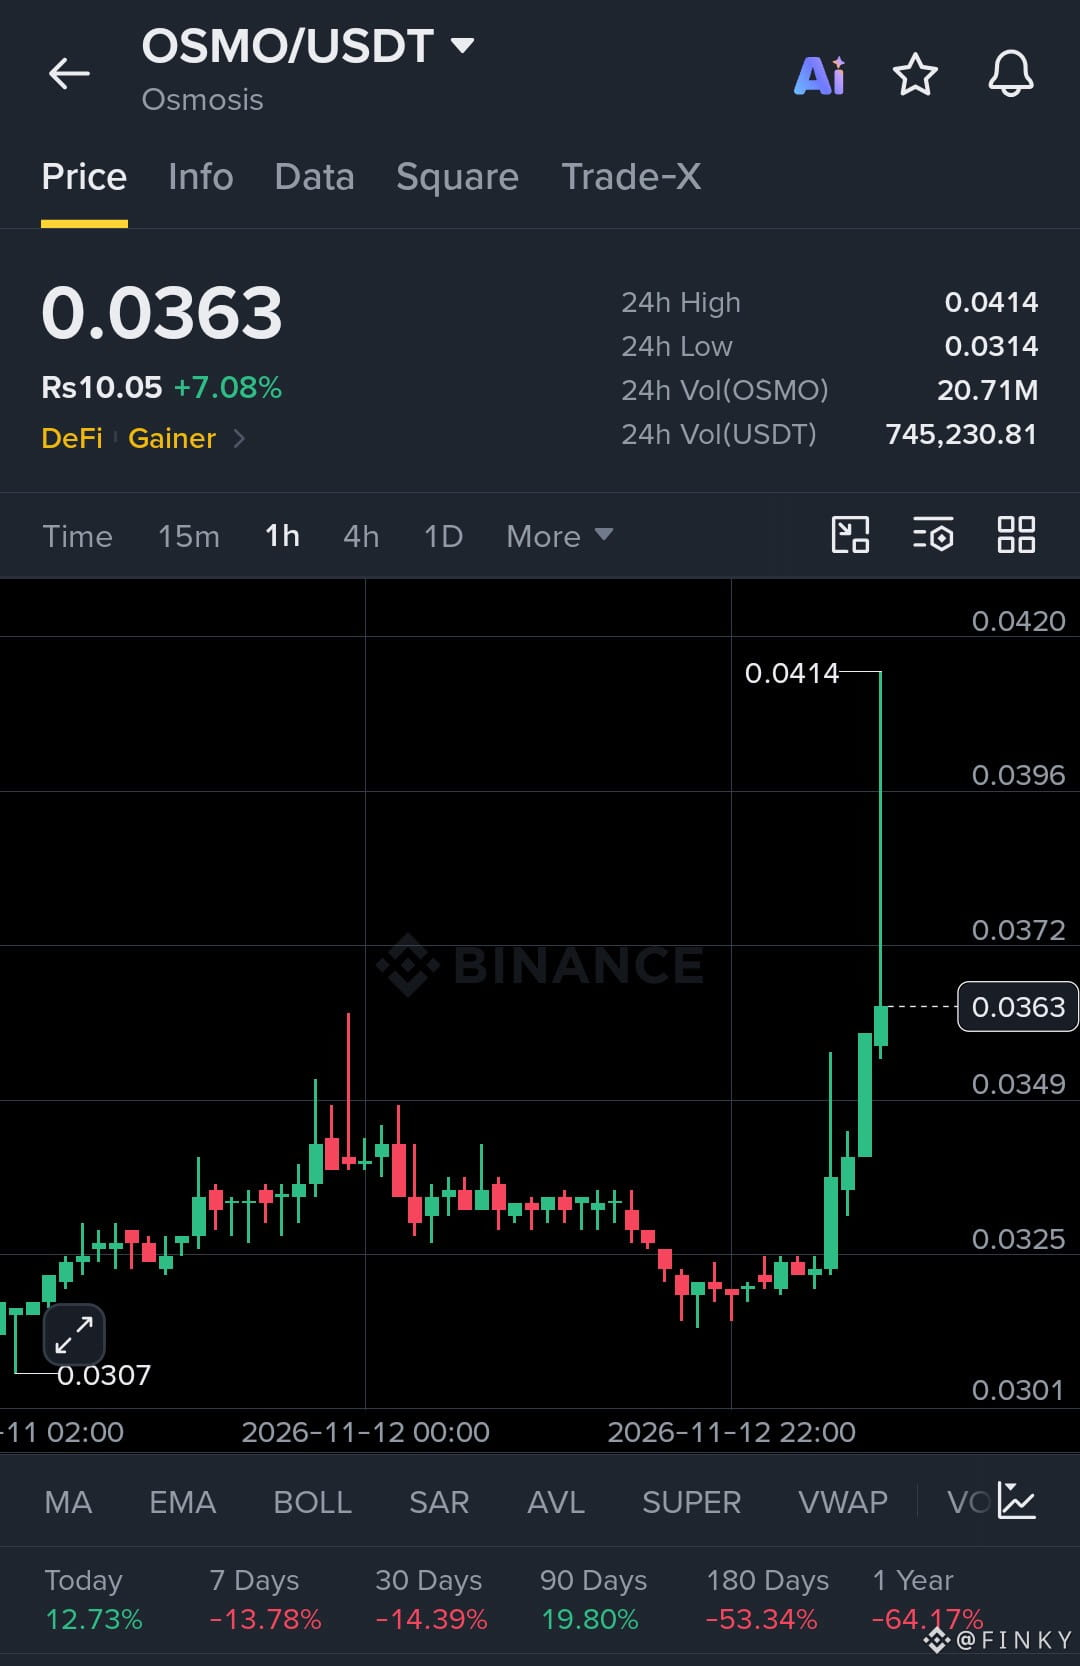
OSMO is showing a strong bullish move on the 1-hour chart. Price is currently trading around $0.0363, up 7.08%, after breaking out of a long consolidation zone.
The interesting part is where this move started. Buyers defended the $0.0307 area, built a base around $0.0320, and then pushed price sharply higher. Now OSMO has reached $0.0414 before pulling back toward $0.0363.
This is a strong move, but the long upper wick tells us sellers are also active. Bulls still need to prove they can hold the breakout.
Key Market Details:
- Current Price: $0.0363
- 24H High: $0.0414
- 24H Low: $0.0314
- 24H Volume: $745,230.81 USDT
- 24H Change: +7.08%
My Trading Plan:
Entry (EP): $0.0350–$0.0360
Stop Loss (SL): $0.0338
TP1: $0.0372
TP2: $0.0396
TP3: $0.0414
Bullish Scenario:
If OSMO holds above $0.0349 and buyers regain momentum, another attempt toward $0.0396 and $0.0414 could follow. A clean break above $0.0414 would be the next major confirmation.
Bearish Scenario:
If price loses $0.0349, the breakout could weaken. Watch $0.0325 as the next important support area.
My focus is simple: don't chase the sudden green candles. Let OSMO establish support before considering an entry.
Cash is a position. Patience is part of trading.
Can OSMO reclaim $0.0414, or will sellers stop this recovery?
Risk managed. Eyes on the targets. Let's go
#HuangExitNvidiaStrategyInFocus #AnthropicRejectsIPODelayValuationinQuestion #ChipStocksExtendLossesAfterNvidiaCEOChange #TrezorConfirmsMaliciousImplantsIn3Safe5Devices #SoFiExpandsSoFiUSDStablecoinToPolygon
OSMO is showing a strong bullish move on the 1-hour chart. Price is currently trading around $0.0363, up 7.08%, after breaking out of a long consolidation zone.
The interesting part is where this move started. Buyers defended the $0.0307 area, built a base around $0.0320, and then pushed price sharply higher. Now OSMO has reached $0.0414 before pulling back toward $0.0363.
This is a strong move, but the long upper wick tells us sellers are also active. Bulls still need to prove they can hold the breakout.
Key Market Details:
- Current Price: $0.0363
- 24H High: $0.0414
- 24H Low: $0.0314
- 24H Volume: $745,230.81 USDT
- 24H Change: +7.08%
My Trading Plan:
Entry (EP): $0.0350–$0.0360
Stop Loss (SL): $0.0338
TP1: $0.0372
TP2: $0.0396
TP3: $0.0414
Bullish Scenario:
If OSMO holds above $0.0349 and buyers regain momentum, another attempt toward $0.0396 and $0.0414 could follow. A clean break above $0.0414 would be the next major confirmation.
Bearish Scenario:
If price loses $0.0349, the breakout could weaken. Watch $0.0325 as the next important support area.
My focus is simple: don't chase the sudden green candles. Let OSMO establish support before considering an entry.
Cash is a position. Patience is part of trading.
Can OSMO reclaim $0.0414, or will sellers stop this recovery?
Risk managed. Eyes on the targets. Let's go
#HuangExitNvidiaStrategyInFocus #AnthropicRejectsIPODelayValuationinQuestion #ChipStocksExtendLossesAfterNvidiaCEOChange #TrezorConfirmsMaliciousImplantsIn3Safe5Devices #SoFiExpandsSoFiUSDStablecoinToPolygon