$KITE : Candles Cannot Identify Whales or Insiders
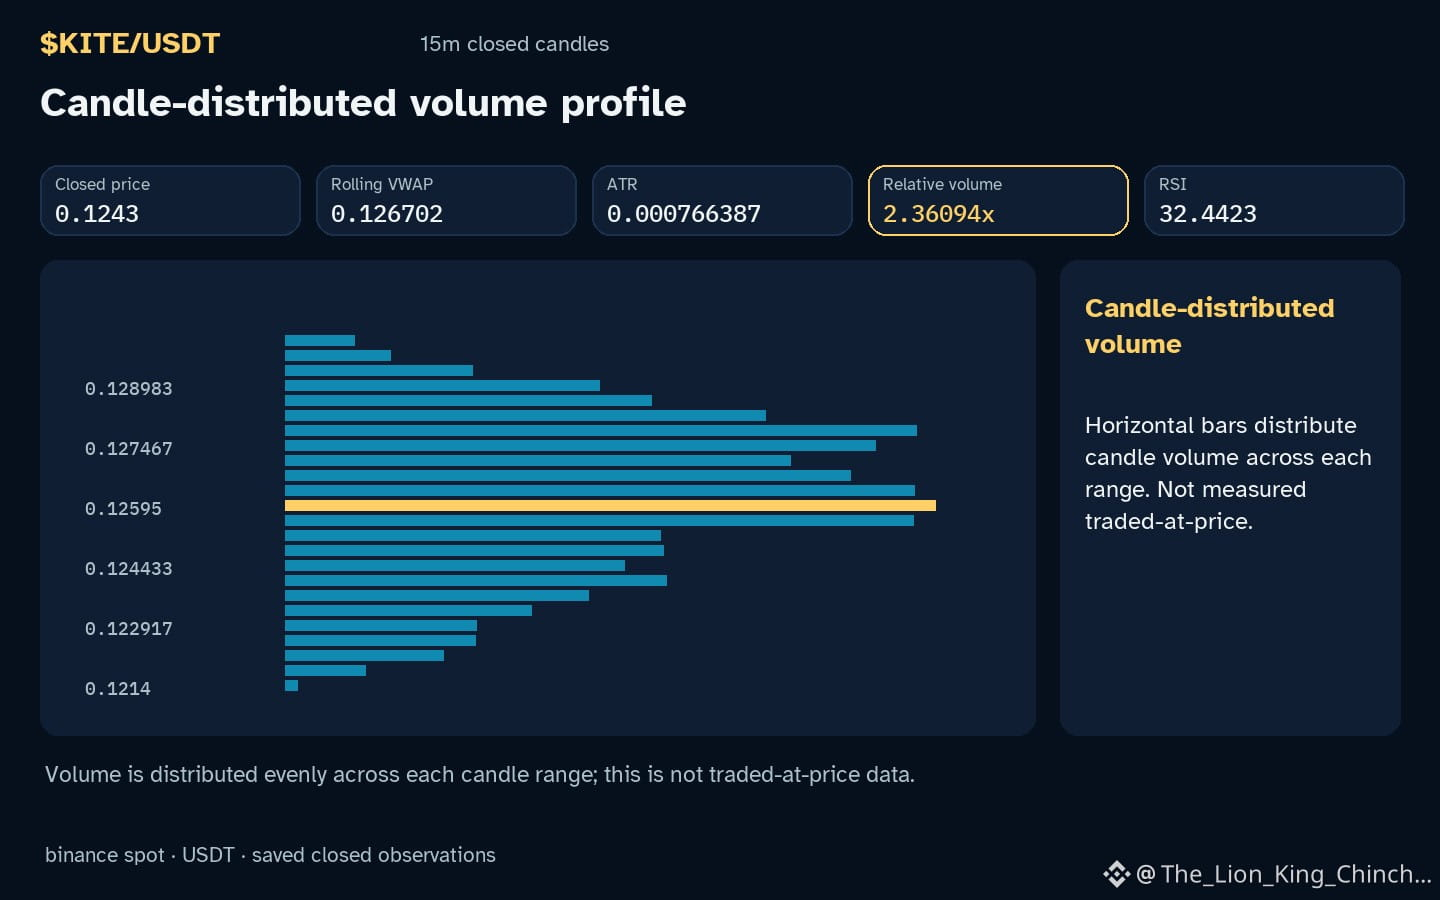
$KITE : KITE trades below local support with relative volume running 2.36x baseline. Why do traders often invent secret narratives to explain such standard price action? We frame this as a hypothetical mechanism, not a claim about actual market participants. Do not assume the chart reveals hidden motives. The only facts here are the current position 0.1243 and the relative volume ratio.
A common error is attributing volation to a specific group. For example, seeing higher volume during a drop might suggest panic selling by insiders. Instead, relative volume measures trading activity against a baseline, indicating broad participation rather than intent. If we treat this as a Write to Earn general incentive dilemma, readers may feel compelled to find a story that feels explanatory. This creates a bias toward complex explanations. Keep the interpretation simple. The observation is that price is below support and volume is elevated. Any additional narrative is a hypothesis, not a fact. We should separate the observable data from the persuasive story we build around it.
The limit of this evidence is clear. Candles and volume alone cannot confirm manipulation, exhaustion, or specific trader psychology. A counterexample is that similar volume patterns occur in quiet, organic markets with no hidden players. To self-check, ask if your explanation relies on unseen agents. If the answer is yes, replace it with a conditional statement about probabilities. The reassessment condition is simple: if price reclaims the [[support]] level with sustained volume, the initial interpretation of distribution weakens. Until then, treat the drop as a measurable state, not a narrative outcome. This approach respects the data without demanding false certainty or secret knowledge. Focus on what the numbers show, not what they might imply about invisible actors. 🧊
Probabilistic market research, not a recommendation or guaranteed return.
#KITE
$KITE : KITE trades below local support with relative volume running 2.36x baseline. Why do traders often invent secret narratives to explain such standard price action? We frame this as a hypothetical mechanism, not a claim about actual market participants. Do not assume the chart reveals hidden motives. The only facts here are the current position 0.1243 and the relative volume ratio.
A common error is attributing volation to a specific group. For example, seeing higher volume during a drop might suggest panic selling by insiders. Instead, relative volume measures trading activity against a baseline, indicating broad participation rather than intent. If we treat this as a Write to Earn general incentive dilemma, readers may feel compelled to find a story that feels explanatory. This creates a bias toward complex explanations. Keep the interpretation simple. The observation is that price is below support and volume is elevated. Any additional narrative is a hypothesis, not a fact. We should separate the observable data from the persuasive story we build around it.
The limit of this evidence is clear. Candles and volume alone cannot confirm manipulation, exhaustion, or specific trader psychology. A counterexample is that similar volume patterns occur in quiet, organic markets with no hidden players. To self-check, ask if your explanation relies on unseen agents. If the answer is yes, replace it with a conditional statement about probabilities. The reassessment condition is simple: if price reclaims the [[support]] level with sustained volume, the initial interpretation of distribution weakens. Until then, treat the drop as a measurable state, not a narrative outcome. This approach respects the data without demanding false certainty or secret knowledge. Focus on what the numbers show, not what they might imply about invisible actors. 🧊
Probabilistic market research, not a recommendation or guaranteed return.
#KITE