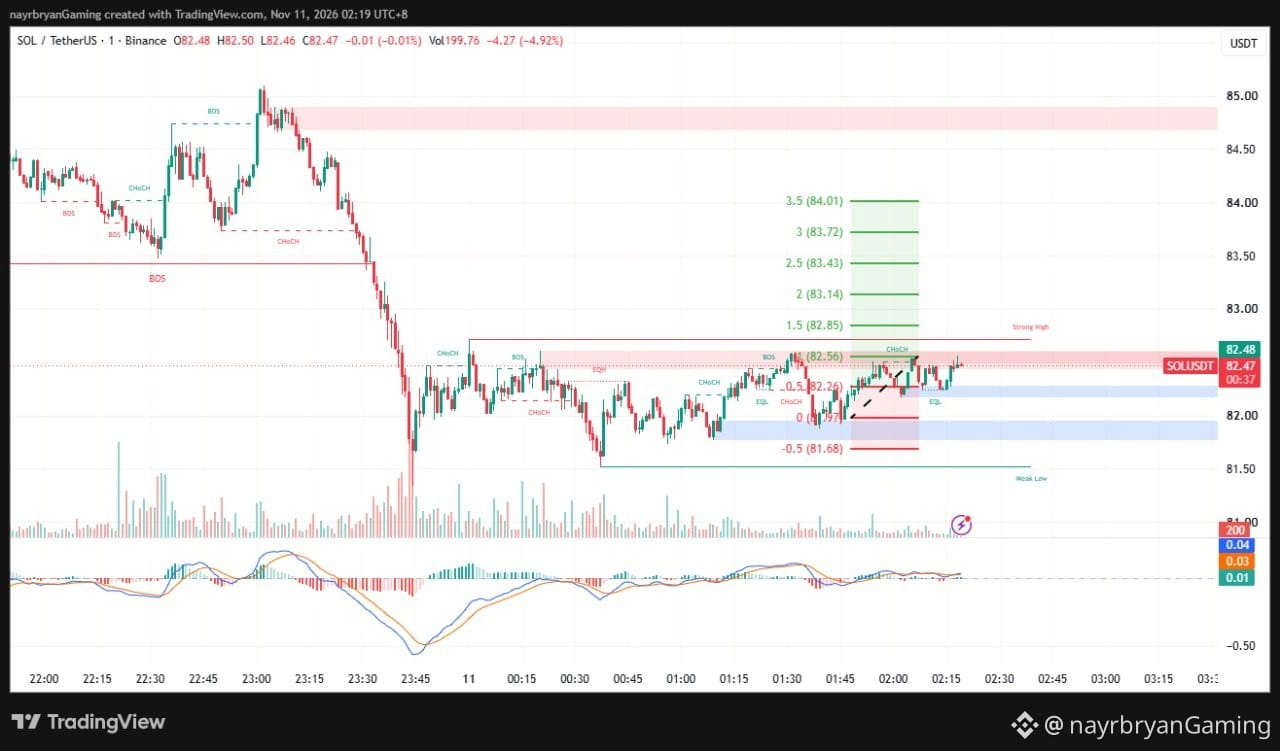
LIGHT ANALYSIS / CHART SETUP — SOL/USDT
📈 STRUCTURE OVERVIEW
Market Phase:
Sharp decline → Base formation → Short-term recovery → Resistance test
Current Price:
82.47
Immediate Resistance:
82.50–82.56
Key Supply Zone:
82.45–82.60
Major Resistance:
82.70–82.85
Initial Support:
82.26
Major Support:
82.20–82.30
Secondary Support:
81.80–81.95
Weak-Low Reference:
81.50
---
📌 WHAT I'M WATCHING
SCENARIO A — BULLISH CONTINUATION
If SOL breaks above 82.56 with convincing price action and volume confirmation, the recovery could extend toward:
82.85 → 83.14 → 83.43 → 83.72 → 84.01.
Watch for a successful retest of the breakout area before considering continuation.
SCENARIO B — BEARISH REJECTION
If SOL fails to overcome the 82.45–82.60 supply zone, sellers could regain short-term control.
A loss of 82.26 could expose:
81.97 → 81.68.
Further weakness could bring the 81.80–81.95 demand region into focus, depending on the price reaction.
---
📊 INDICATOR CHECK
MACD:
Slightly positive, approximately 0.04 / 0.03.
Histogram:
Approximately 0.01.
Price Structure:
Short-term recovery following a major bearish move.
Current Price:
82.47.
Immediate Breakout Reference:
82.56.
Initial Support Reference:
82.26.
Bullish Confirmation:
Breakout and acceptance above 82.56.
Bearish Warning:
Rejection from supply followed by a confirmed loss of 82.26.
---
📝 CHART NOTE
SOL is approaching an important resistance decision point after recovering from the lower structure.
The short-term recovery is visible, but the broader bearish context should not be ignored.
Watch the reaction around 82.45–82.60.
Confirmation matters more than anticipation.
This is an educational chart framework, not a trade recommendation.
— @nayrbryanGaming
#SOLAnalysis #ChartSetup #PriceAction #SmartMoney #Fibonacci #CryptoTrading #TechnicalAnalysis #MarketStructure #DYOR #NFA
📈 STRUCTURE OVERVIEW
Market Phase:
Sharp decline → Base formation → Short-term recovery → Resistance test
Current Price:
82.47
Immediate Resistance:
82.50–82.56
Key Supply Zone:
82.45–82.60
Major Resistance:
82.70–82.85
Initial Support:
82.26
Major Support:
82.20–82.30
Secondary Support:
81.80–81.95
Weak-Low Reference:
81.50
---
📌 WHAT I'M WATCHING
SCENARIO A — BULLISH CONTINUATION
If SOL breaks above 82.56 with convincing price action and volume confirmation, the recovery could extend toward:
82.85 → 83.14 → 83.43 → 83.72 → 84.01.
Watch for a successful retest of the breakout area before considering continuation.
SCENARIO B — BEARISH REJECTION
If SOL fails to overcome the 82.45–82.60 supply zone, sellers could regain short-term control.
A loss of 82.26 could expose:
81.97 → 81.68.
Further weakness could bring the 81.80–81.95 demand region into focus, depending on the price reaction.
---
📊 INDICATOR CHECK
MACD:
Slightly positive, approximately 0.04 / 0.03.
Histogram:
Approximately 0.01.
Price Structure:
Short-term recovery following a major bearish move.
Current Price:
82.47.
Immediate Breakout Reference:
82.56.
Initial Support Reference:
82.26.
Bullish Confirmation:
Breakout and acceptance above 82.56.
Bearish Warning:
Rejection from supply followed by a confirmed loss of 82.26.
---
📝 CHART NOTE
SOL is approaching an important resistance decision point after recovering from the lower structure.
The short-term recovery is visible, but the broader bearish context should not be ignored.
Watch the reaction around 82.45–82.60.
Confirmation matters more than anticipation.
This is an educational chart framework, not a trade recommendation.
— @nayrbryanGaming
#SOLAnalysis #ChartSetup #PriceAction #SmartMoney #Fibonacci #CryptoTrading #TechnicalAnalysis #MarketStructure #DYOR #NFA