

COMEX closes on Friday evening. Spot gold dealers go quiet until Sunday evening (New York time). XAUUSDT on Binance keeps trading through all of it.
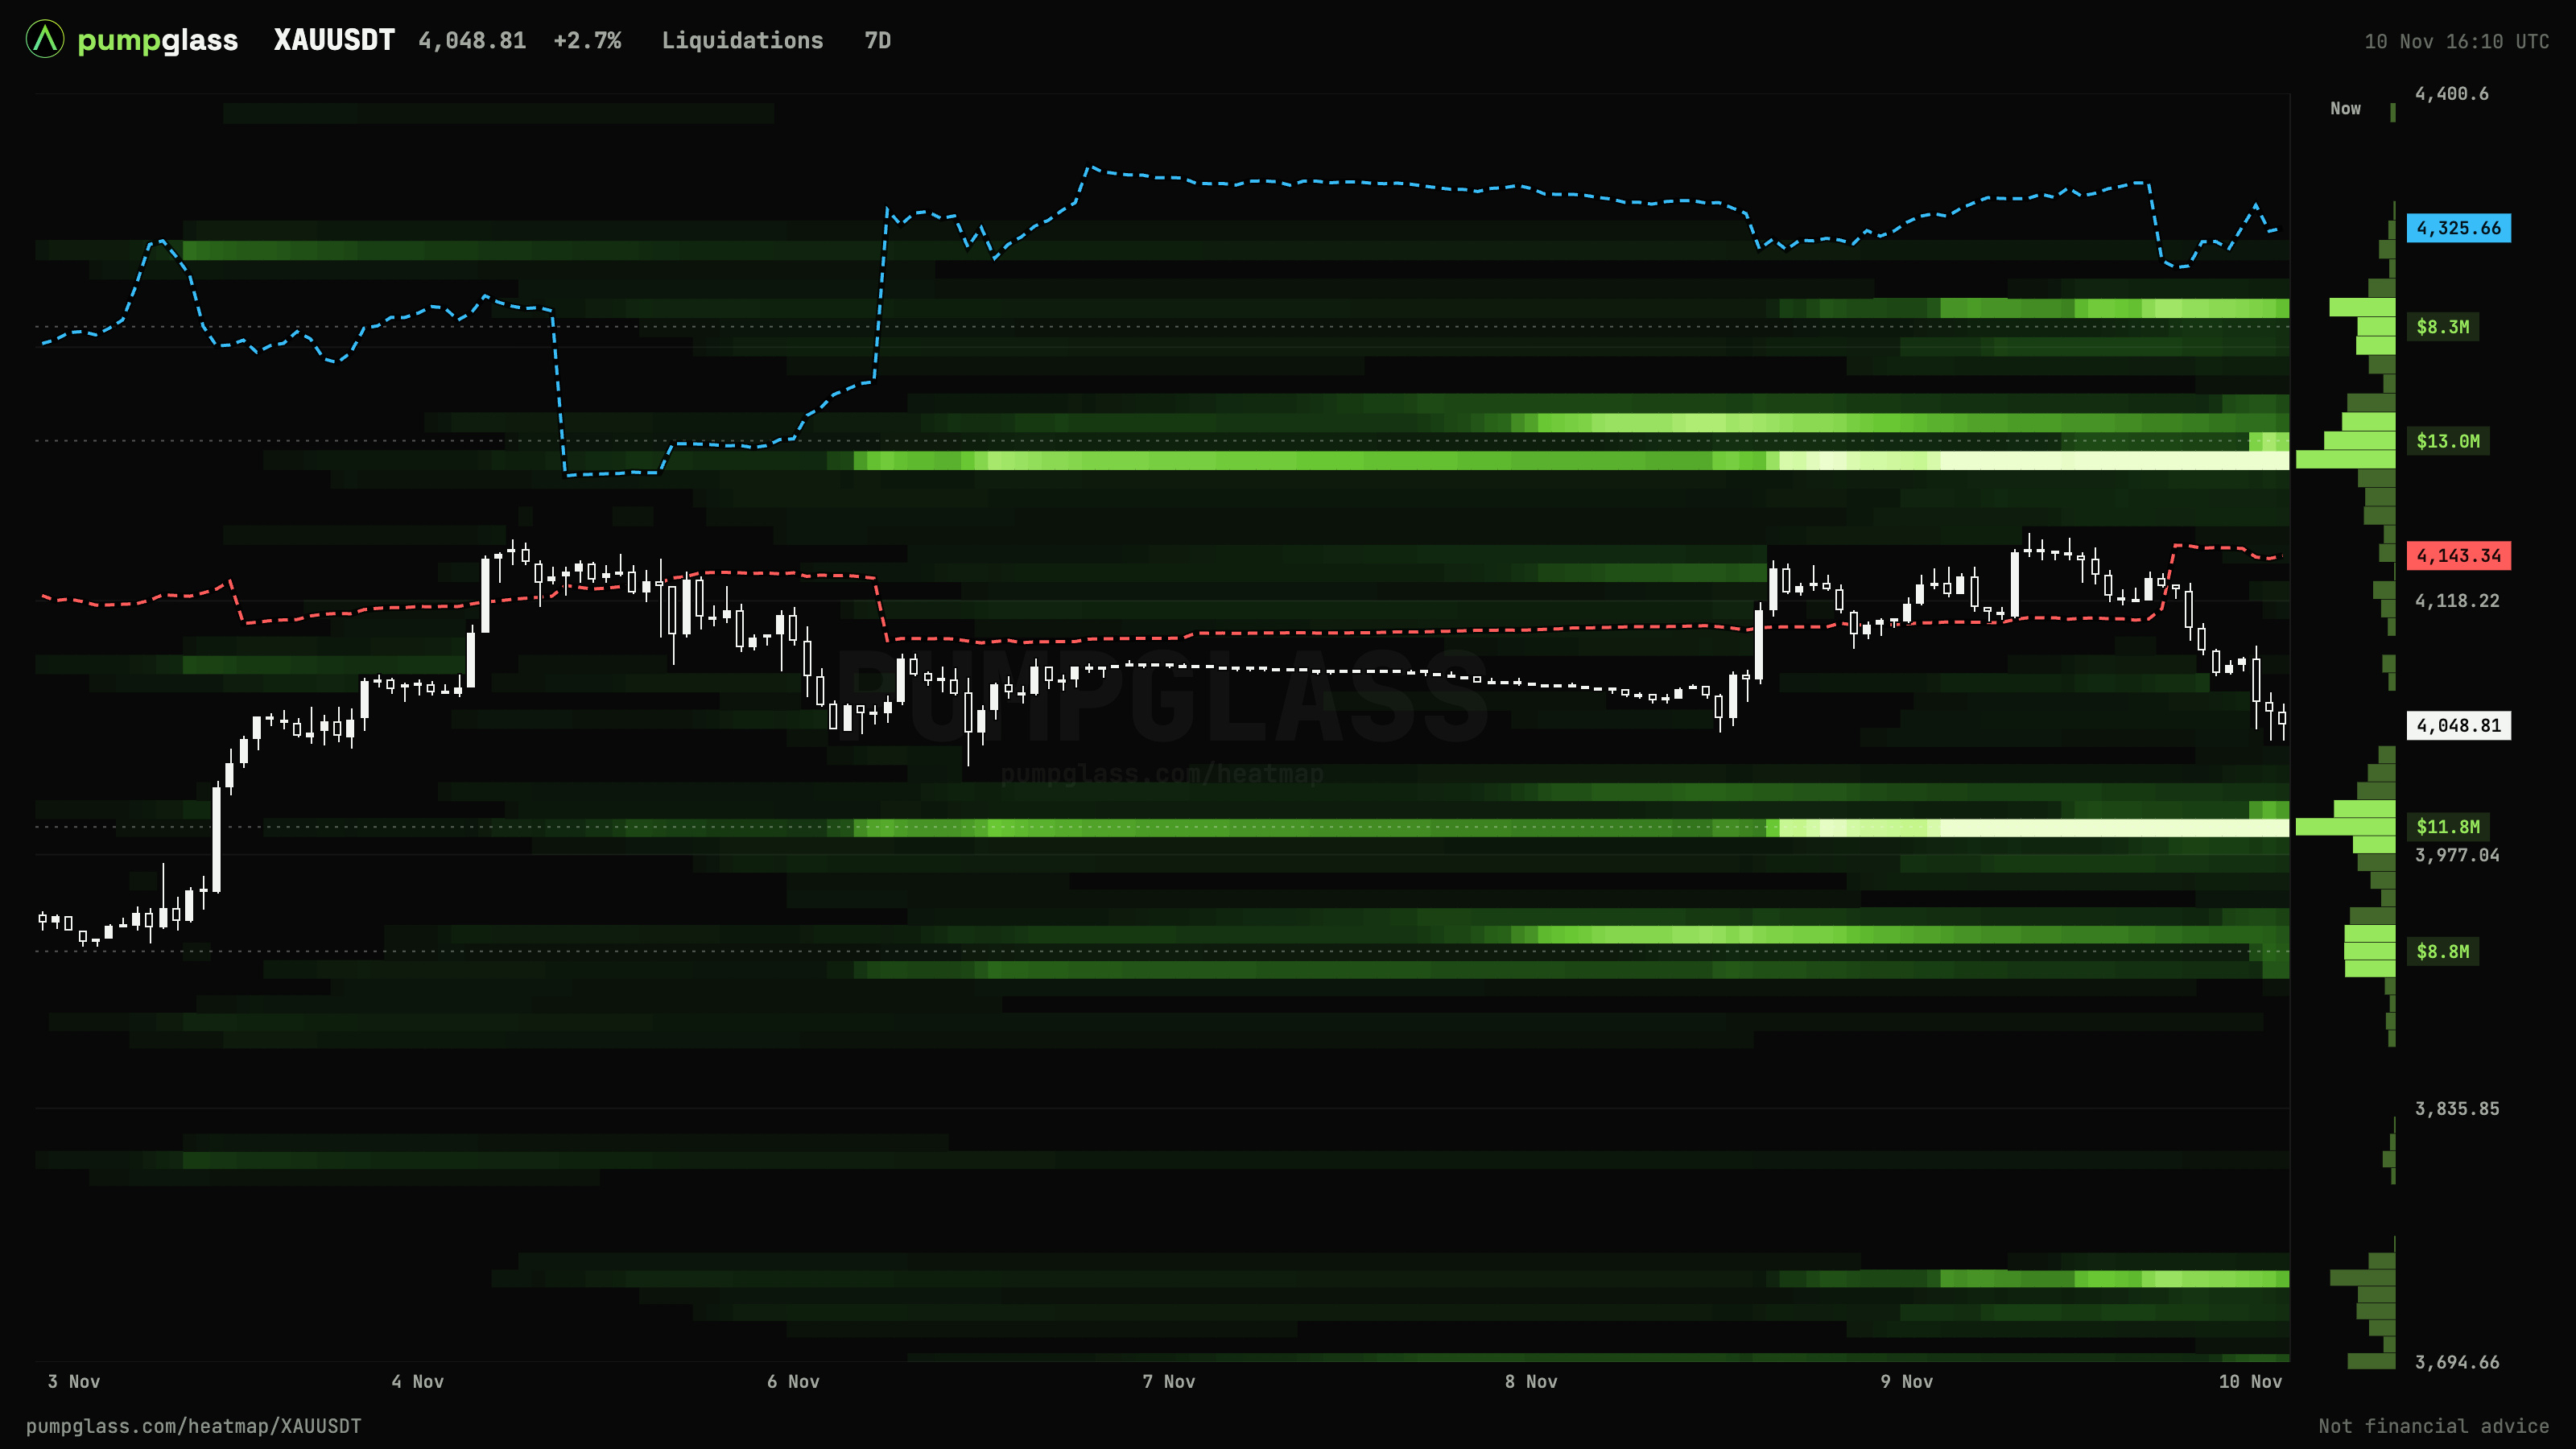
That one difference changes how gold behaves on Binance futures, and the liquidation map is the easiest place to see it.
What happens on weekends
During the week, XAUUSDT is tied to the wider gold market: arbitrage with COMEX futures and spot keeps the price in line, and outside liquidity absorbs large orders.
On weekends that link weakens. The order book on XAUUSDT is usually thinner, fewer large players are active, and the price can move further on less volume.
Leverage does not take the weekend off. Positions opened during the week keep their liquidation prices, and funding keeps being paid every few hours.
What to look at on the map
Bands close to the price. On a weekday a cluster 1% away is just one of many levels. On a weekend, with a thinner book, the same cluster matters more: there is less resting liquidity around it to absorb forced orders.
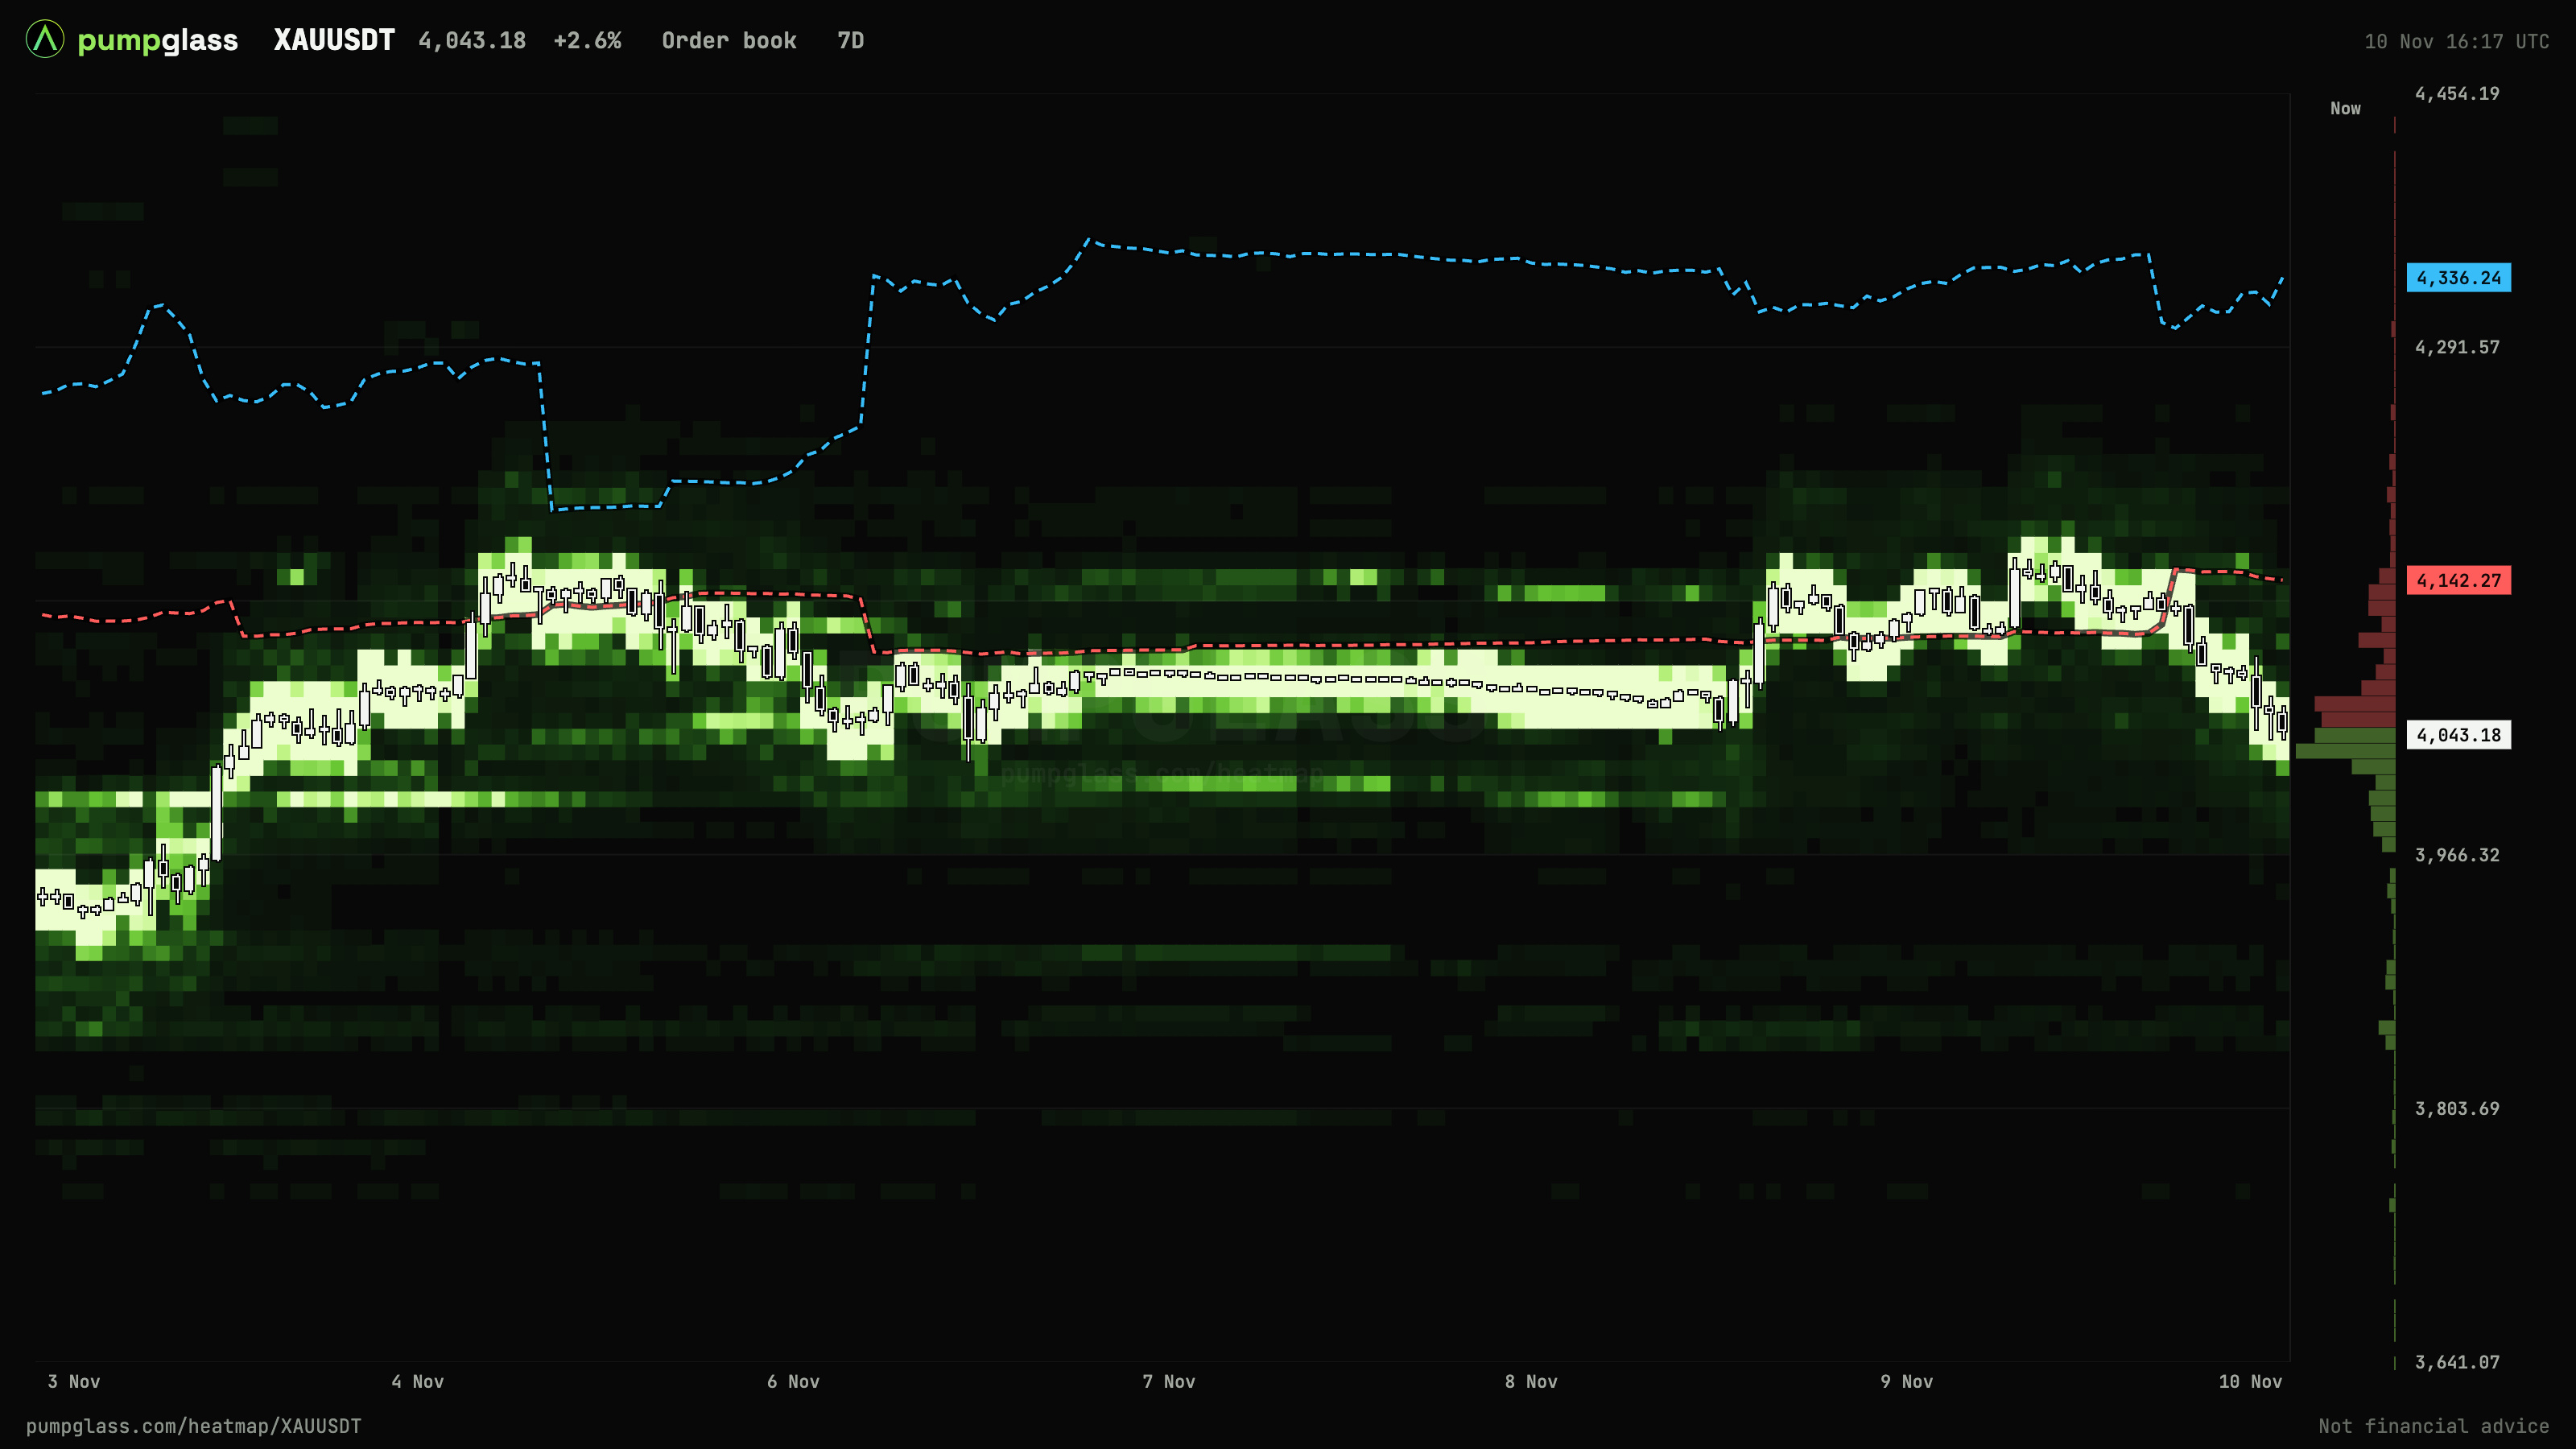
The real order book next to it. Switch the map to the order book layer. A liquidation band with a large resting order nearby is a different picture from a band sitting in an empty book.
Sunday evening. When traditional markets reopen, the Binance price meets the rest of the gold market again. A weekend move that ran far on thin liquidity meets fresh liquidity at that moment.
Macro days are the other half
Gold reacts to US CPI, PPI, PCE, jobs reports, Fed decisions. They come at fixed times, usually 13:30 UTC in winter and 19:00 UTC for Fed decisions.
Before a release, check how much estimated liquidation sits within 1 to 3% of the price on each side. A release that moves gold 1.5% sweeps everything in that range. The map does not tell you the direction, it tells you how much leverage is parked where the move is most likely to reach.
Whales on gold
Gold is one of the few markets where the gap between large traders and the crowd can stay wide for days. If whales lean one way and most accounts lean the other, the liquidation map shows where the crowded side is exposed.
Limits
The liquidation map is an estimate built from open interest and typical leverage, not a list of real orders.
It covers Binance XAUUSDT only, not COMEX.
Bright bands show where leverage sits, not where price will go.
The map I use for this is the free PumpGlass gold heatmap: liquidations, the real order book and whale entries on one chart, with no signup. Search "PumpGlass gold heatmap".
Not financial advice. Leveraged futures can lose everything you put in.