🔥 $ZEC Technical Update: Key Levels & Momentum Breakdown
📊 1. Market Snapshot
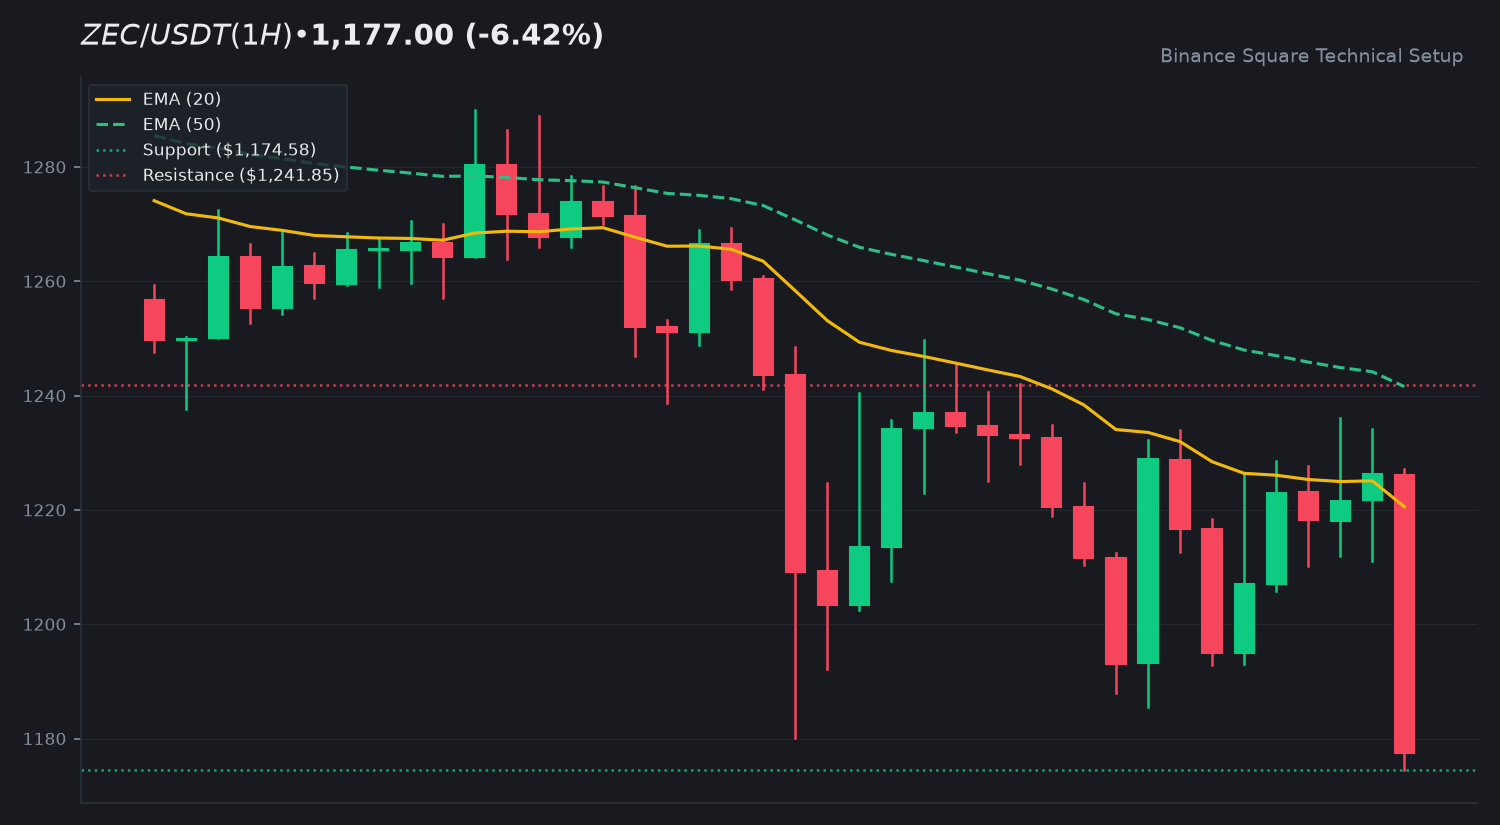
The $ZEC asset is trading at $1,177.0000, registering a 24-hour decline of 6.42 percent. Price action moved between a daily high of $1,269.2700 and a low of $1,174.5800, backed by robust trading activity with a 24-hour quote volume reaching $213,212,844 USDT.
📈 2. Technical Momentum & Indicator Bias
The multi-timeframe trend reflects a sustained downward bias. Price sits below both the EMA 20 at $1,220.5464 and the EMA 50 at $1,241.5523, indicating continuing selling pressure. The 14-period RSI prints at 35.93, approaching oversold territory without a confirmed reversal signal. Meanwhile, the MACD histogram registers at -0.2494, confirming ongoing bearish momentum within the current structure.
🎯 3. Key Technical Levels to Watch
• 🟢 Resistance Zone: The immediate overhead hurdle rests near the EMA 50 region at $1,241.8450, with secondary resistance extending toward $1,278.9500.
• 🔴 Support Zone: The primary floor is established at the daily low of $1,174.5800.
• 🛡️ Pivot Confluence: The EMA 20 line around $1,220.5464 serves as the primary dynamic pivot to gauge any short-term trend shift.
💡 4. Technical Takeaway & Risk Management
Market participants are closely monitoring how price behaves near the immediate support floor. Sustained rejection below the EMA 20 dynamic barrier preserves the prevailing downward trajectory, making volume confirmation essential for identifying potential trend stabilization.
💬 5. Community Discussion
What is your technical outlook for $ZEC this week? Are you monitoring range accumulation or waiting for structural confirmation? Drop your thoughts below! 👇
⚠️ 6. Disclaimer
Educational technical analysis only. Not financial advice (NFA). Crypto markets involve risk. Always DYOR.
$ZEC #ZEC #BinanceSquare
📊 1. Market Snapshot
The $ZEC asset is trading at $1,177.0000, registering a 24-hour decline of 6.42 percent. Price action moved between a daily high of $1,269.2700 and a low of $1,174.5800, backed by robust trading activity with a 24-hour quote volume reaching $213,212,844 USDT.
📈 2. Technical Momentum & Indicator Bias
The multi-timeframe trend reflects a sustained downward bias. Price sits below both the EMA 20 at $1,220.5464 and the EMA 50 at $1,241.5523, indicating continuing selling pressure. The 14-period RSI prints at 35.93, approaching oversold territory without a confirmed reversal signal. Meanwhile, the MACD histogram registers at -0.2494, confirming ongoing bearish momentum within the current structure.
🎯 3. Key Technical Levels to Watch
• 🟢 Resistance Zone: The immediate overhead hurdle rests near the EMA 50 region at $1,241.8450, with secondary resistance extending toward $1,278.9500.
• 🔴 Support Zone: The primary floor is established at the daily low of $1,174.5800.
• 🛡️ Pivot Confluence: The EMA 20 line around $1,220.5464 serves as the primary dynamic pivot to gauge any short-term trend shift.
💡 4. Technical Takeaway & Risk Management
Market participants are closely monitoring how price behaves near the immediate support floor. Sustained rejection below the EMA 20 dynamic barrier preserves the prevailing downward trajectory, making volume confirmation essential for identifying potential trend stabilization.
💬 5. Community Discussion
What is your technical outlook for $ZEC this week? Are you monitoring range accumulation or waiting for structural confirmation? Drop your thoughts below! 👇
⚠️ 6. Disclaimer
Educational technical analysis only. Not financial advice (NFA). Crypto markets involve risk. Always DYOR.
$ZEC #ZEC #BinanceSquare