🔥 $ARB Technical Update: Key Levels & Momentum Breakdown
📊 1. Market Snapshot
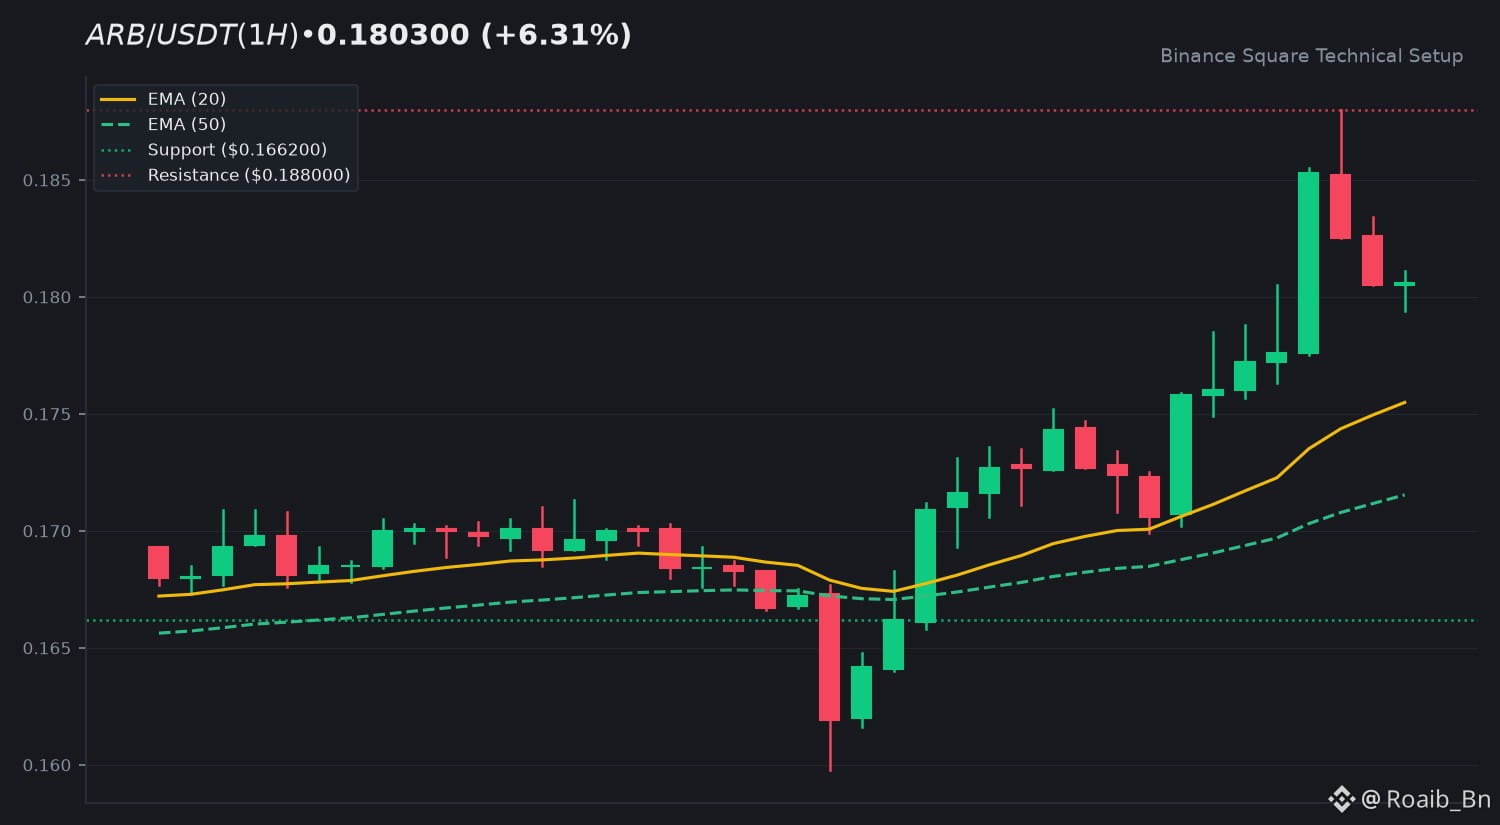
$ARB is currently trading at $0.1803, recording a solid 24-hour gain of +6.31%. Price action reached a 24-hour high of $0.1880 after bouncing from a daily low of $0.1598, backed by a steady 24-hour quote volume of $27.6M USDT.
📈 2. Technical Momentum & Indicator Bias
The trend structure shows sustained upward momentum, with the fast EMA 20 sitting at $0.1755 above the EMA 50 at $0.1715. The Relative Strength Index (RSI 14) prints at 64.01, reflecting active buyer control without entering overbought extremes. Furthermore, the MACD histogram registers a positive value of +0.0009 with the MACD line crossing above the signal line, confirming ongoing bullish continuation characteristics.
🎯 3. Key Technical Levels to Watch
• 🟢 Resistance Zone: The immediate ceiling rests at the $0.1880 24-hour high.
• 🔴 Support Zone: Initial support is located around the $0.1662 mark, with secondary defense near the $0.1598 low.
• 🛡️ Pivot Confluence: The EMA 20 at $0.1755 acts as a crucial dynamic pivot for short-term trend health.
💡 4. Technical Takeaway & Risk Management
Price action remains constructive as long as candles close above the key moving averages. Traders often monitor whether volume expands during tests of overhead resistance or if a consolidation phase develops near current structural boundaries.
💬 5. Community Discussion
What is your technical outlook for $ARB this week? Are you tracking the EMA levels or waiting for volume confirmation? Drop your thoughts below! 👇
⚠️ 6. Disclaimer
Educational technical analysis only. Not financial advice (NFA). Crypto markets involve risk. Always DYOR.
$ARB #ARB #BinanceSquare
📊 1. Market Snapshot
$ARB is currently trading at $0.1803, recording a solid 24-hour gain of +6.31%. Price action reached a 24-hour high of $0.1880 after bouncing from a daily low of $0.1598, backed by a steady 24-hour quote volume of $27.6M USDT.
📈 2. Technical Momentum & Indicator Bias
The trend structure shows sustained upward momentum, with the fast EMA 20 sitting at $0.1755 above the EMA 50 at $0.1715. The Relative Strength Index (RSI 14) prints at 64.01, reflecting active buyer control without entering overbought extremes. Furthermore, the MACD histogram registers a positive value of +0.0009 with the MACD line crossing above the signal line, confirming ongoing bullish continuation characteristics.
🎯 3. Key Technical Levels to Watch
• 🟢 Resistance Zone: The immediate ceiling rests at the $0.1880 24-hour high.
• 🔴 Support Zone: Initial support is located around the $0.1662 mark, with secondary defense near the $0.1598 low.
• 🛡️ Pivot Confluence: The EMA 20 at $0.1755 acts as a crucial dynamic pivot for short-term trend health.
💡 4. Technical Takeaway & Risk Management
Price action remains constructive as long as candles close above the key moving averages. Traders often monitor whether volume expands during tests of overhead resistance or if a consolidation phase develops near current structural boundaries.
💬 5. Community Discussion
What is your technical outlook for $ARB this week? Are you tracking the EMA levels or waiting for volume confirmation? Drop your thoughts below! 👇
⚠️ 6. Disclaimer
Educational technical analysis only. Not financial advice (NFA). Crypto markets involve risk. Always DYOR.
$ARB #ARB #BinanceSquare