"𝐒𝐓𝐎𝐏..... 𝐒𝐓𝐎𝐏..... 𝐒𝐓𝐎𝐏 🚨
$BTC DON'T IGNORE THIS Bitcoin BEARISH SCENARIO
Let me be clear: I'm still LONG-TERM BULLISH on Bitcoin
But that doesn't mean we should ignore the downside scenario
Look at the pattern
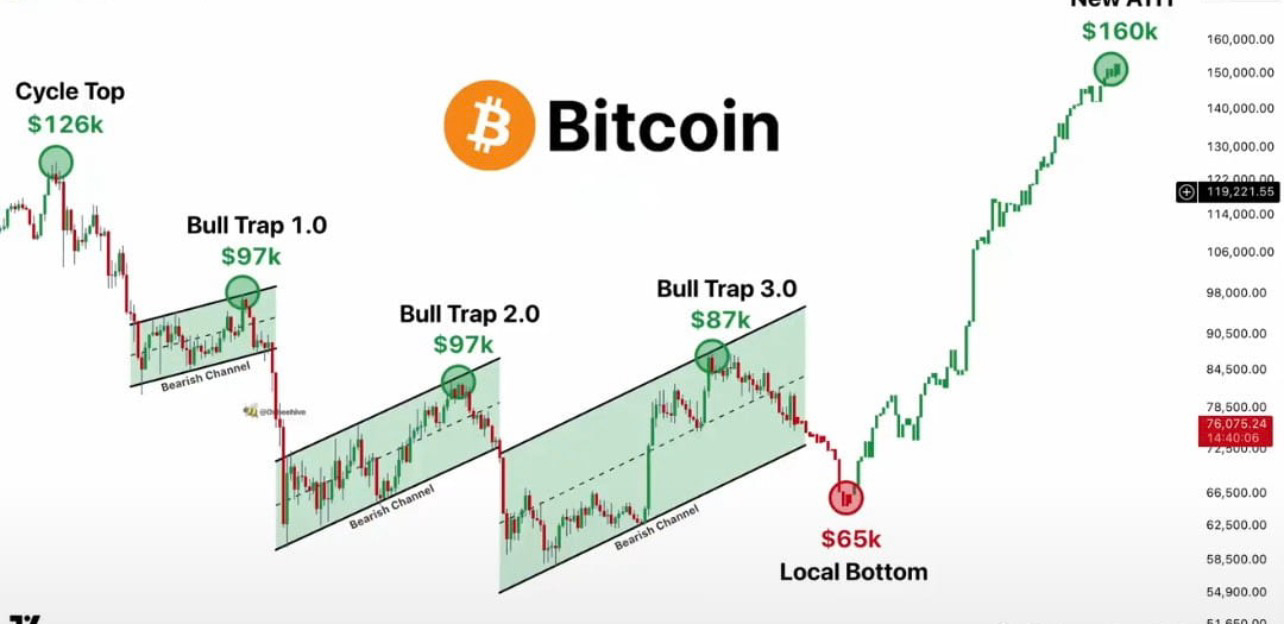
We've already seen three similar bearish channels, each followed by a breakdown
And right now, BTC is still trading inside the third one, around $75K
If macro conditions deteriorate and Bitcoin enters another bear market, I expect a similar scenario to unfold:
- Breakdown from the current channel
- A deeper correction toward $65K
- A potential local bottom
- A new recovery phase
From there, my long-term chart maps out a possible move toward $160K and a new ATH
I'm bullish on the bigger picture, but I want to be prepared for both outcomes" means that the author is warning readers not to focus only on a bullish Bitcoin outlook.
They believe Bitcoin may remain positive over the long term, but they see a technical-chart risk in the near to medium term. Specifically, they believe BTC is moving inside a downward-sloping “bearish channel,” a chart pattern where price makes lower highs and lower lows within two declining trend lines. In the author’s view, similar past channels ended with price breaking below the lower boundary.
Their bearish scenario is conditional: if broader economic conditions worsen and risk appetite falls, BTC could break down from this channel, decline toward about $65K, form a short-term bottom, and later begin recovering. Their longer-term projection then imagines a move toward $160K and a new all-time high.
Importantly, these are chart-based possibilities—not confirmed outcomes. The $65K and $160K figures are the post author’s projected levels, and actual price action can differ because of macroeconomic news, liquidity, regulation, market sentiment, and demand. The above is market analysis and does not constitute investment advice.
$BTC DON'T IGNORE THIS Bitcoin BEARISH SCENARIO
Let me be clear: I'm still LONG-TERM BULLISH on Bitcoin
But that doesn't mean we should ignore the downside scenario
Look at the pattern
We've already seen three similar bearish channels, each followed by a breakdown
And right now, BTC is still trading inside the third one, around $75K
If macro conditions deteriorate and Bitcoin enters another bear market, I expect a similar scenario to unfold:
- Breakdown from the current channel
- A deeper correction toward $65K
- A potential local bottom
- A new recovery phase
From there, my long-term chart maps out a possible move toward $160K and a new ATH
I'm bullish on the bigger picture, but I want to be prepared for both outcomes" means that the author is warning readers not to focus only on a bullish Bitcoin outlook.
They believe Bitcoin may remain positive over the long term, but they see a technical-chart risk in the near to medium term. Specifically, they believe BTC is moving inside a downward-sloping “bearish channel,” a chart pattern where price makes lower highs and lower lows within two declining trend lines. In the author’s view, similar past channels ended with price breaking below the lower boundary.
Their bearish scenario is conditional: if broader economic conditions worsen and risk appetite falls, BTC could break down from this channel, decline toward about $65K, form a short-term bottom, and later begin recovering. Their longer-term projection then imagines a move toward $160K and a new all-time high.
Importantly, these are chart-based possibilities—not confirmed outcomes. The $65K and $160K figures are the post author’s projected levels, and actual price action can differ because of macroeconomic news, liquidity, regulation, market sentiment, and demand. The above is market analysis and does not constitute investment advice.