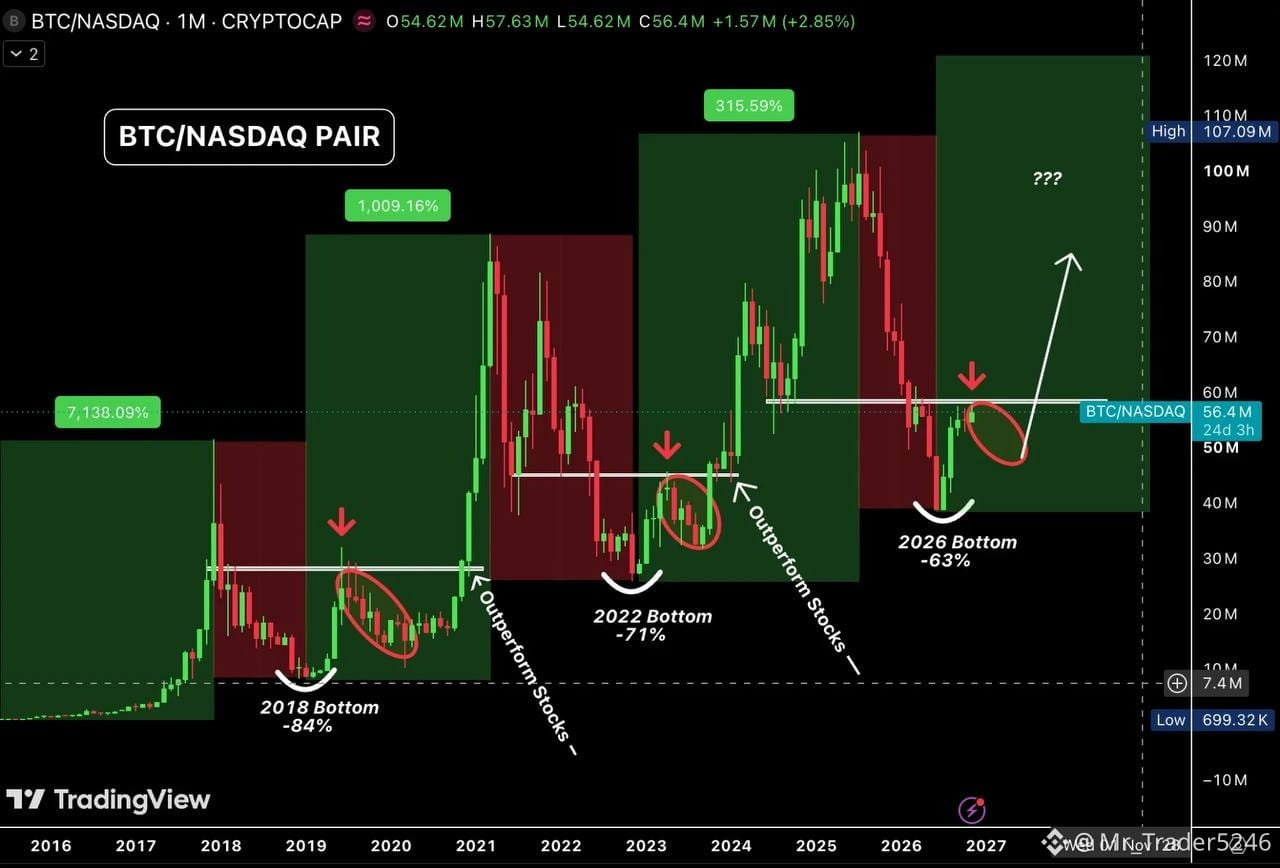
Wall Street has been watching $BTC closely, and this chart tells an interesting story.
Over the past four months, Bitcoin has been outperforming the Nasdaq.
Even this week, while Nasdaq took a hard hit, Bitcoin managed to hold around $75,500. It's also outperforming Nasdaq so far this month.
Now, here's what matters:
-The BTC/Nasdaq pair is testing resistance again.
-If Bitcoin holds its current support, that's a very bullish sign.
-But if it breaks down, we could see another test of the daily MA 200 near $73,240, followed by the weekly MA 200 around $67,760.
Looking at the bigger picture, this structure could take another 6–8 months of sideways movement before the next parabolic rally.
Over the past four months, Bitcoin has been outperforming the Nasdaq.
Even this week, while Nasdaq took a hard hit, Bitcoin managed to hold around $75,500. It's also outperforming Nasdaq so far this month.
Now, here's what matters:
-The BTC/Nasdaq pair is testing resistance again.
-If Bitcoin holds its current support, that's a very bullish sign.
-But if it breaks down, we could see another test of the daily MA 200 near $73,240, followed by the weekly MA 200 around $67,760.
Looking at the bigger picture, this structure could take another 6–8 months of sideways movement before the next parabolic rally.