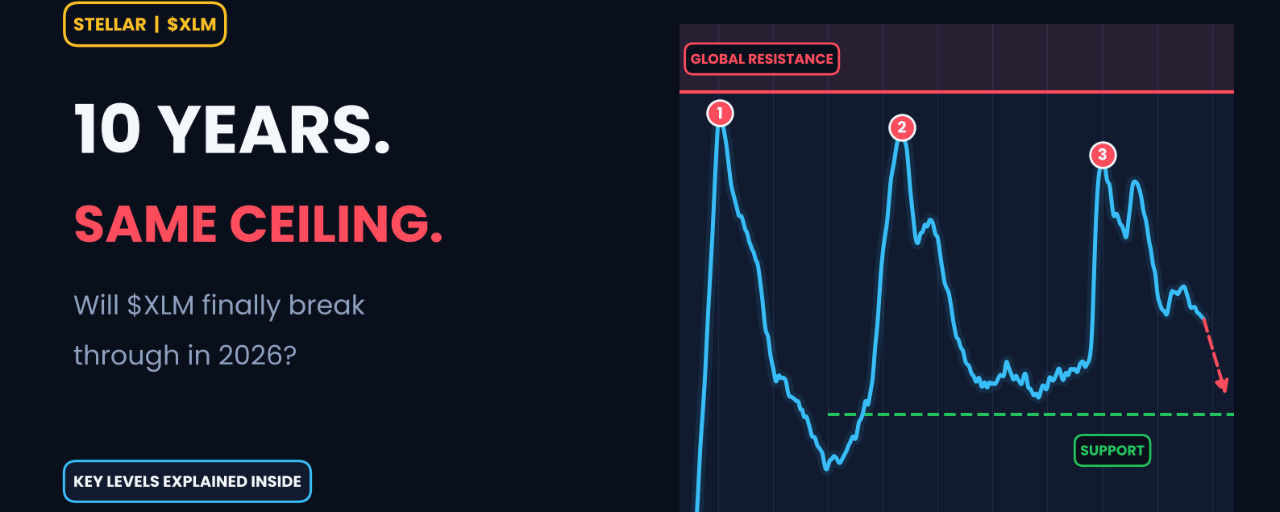

Stellar ($XLM) is one of the longest-running projects in the crypto market, and its price history offers some of the most interesting long-term structure on the charts. Let’s walk through the key levels and what they may be signaling for 2026.
1. Over a Decade of Market Presence
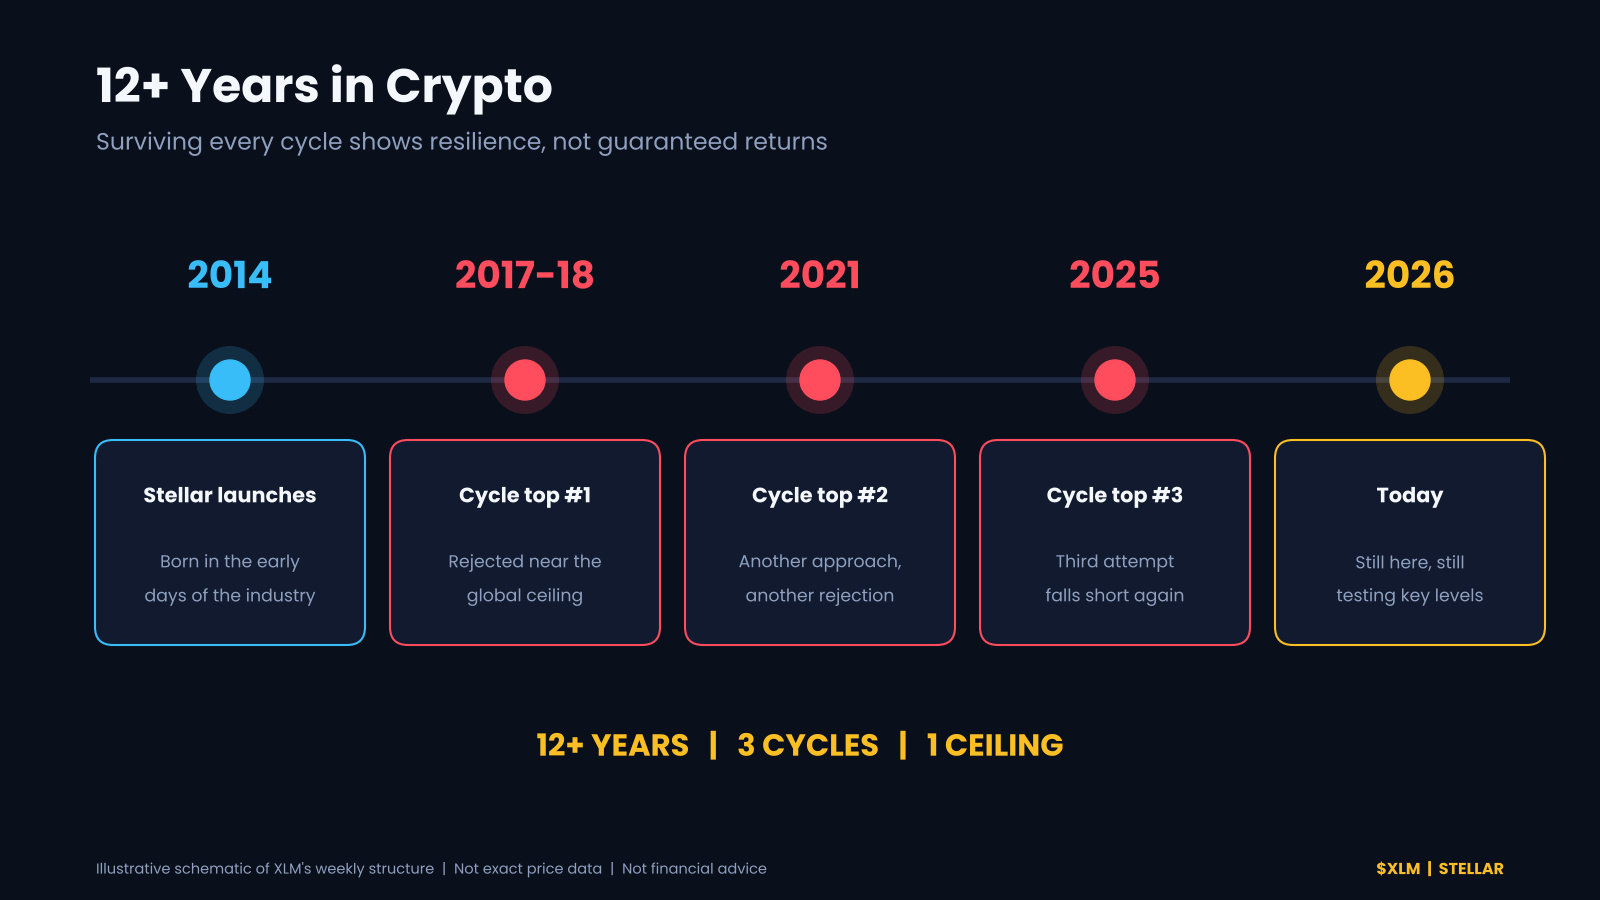
Stellar has been active for more than 12 years, which places it among the true veterans of the industry. Surviving multiple bull and bear cycles is no small achievement. Longevity doesn’t guarantee strong price performance, but it does show resilience.
2. A Global Resistance That Has Held for 10 Years
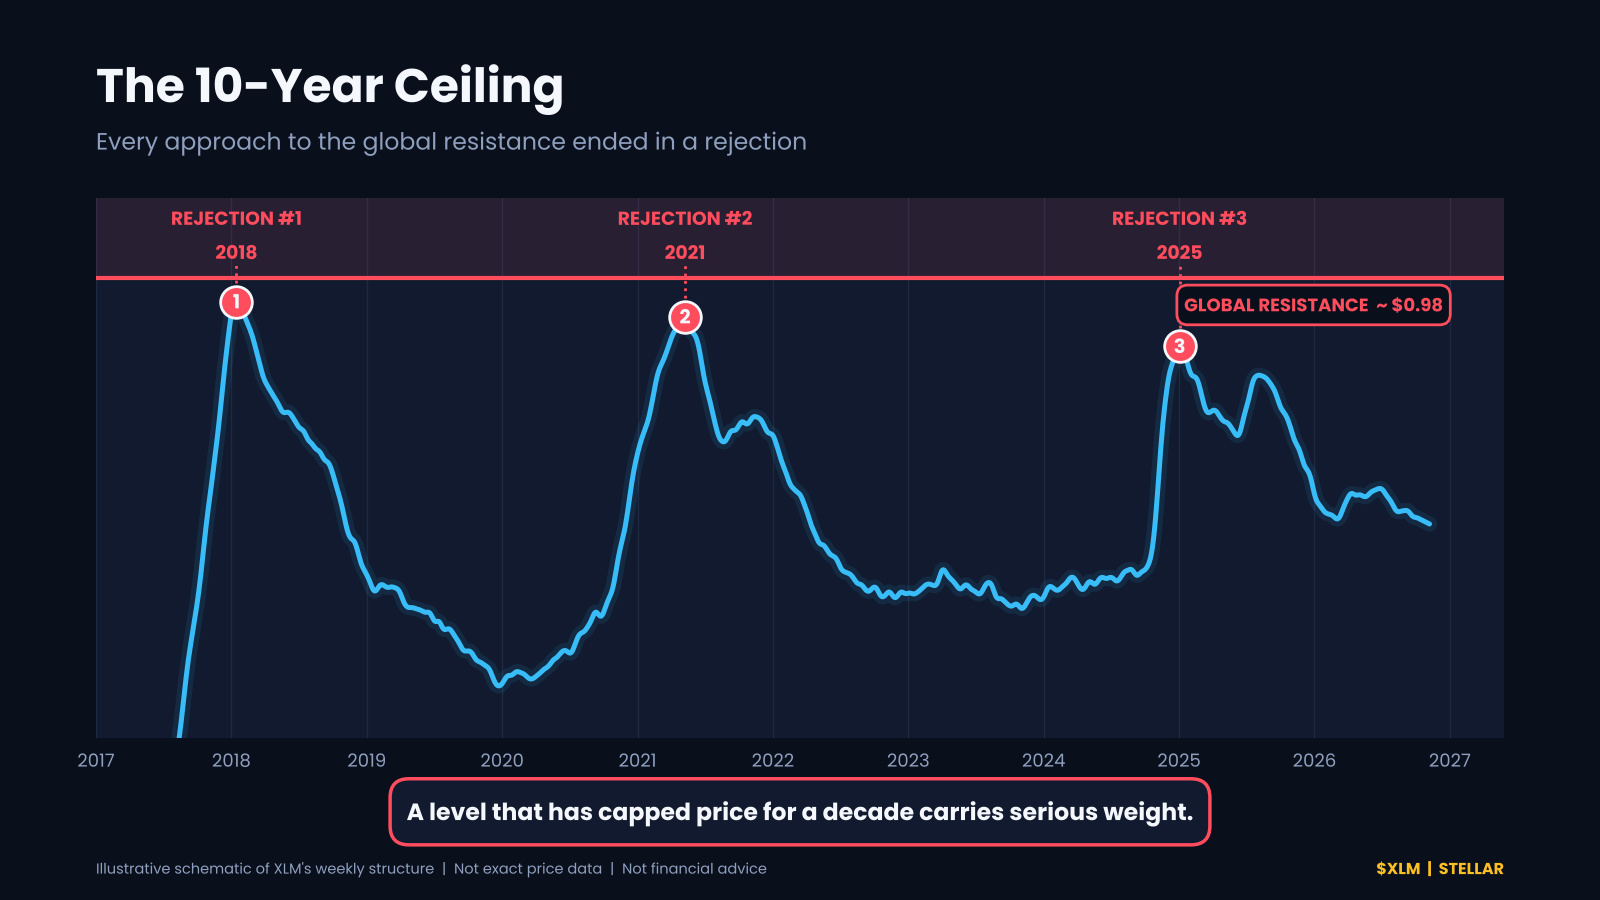
Here is where the chart gets striking. For a full decade, XLM has approached the same long-term resistance zone again and again, and each time it has been rejected, followed by sharp declines. A level that has capped price for ten years carries serious weight. Until it is decisively broken on higher timeframes, it remains the ceiling that matters most.
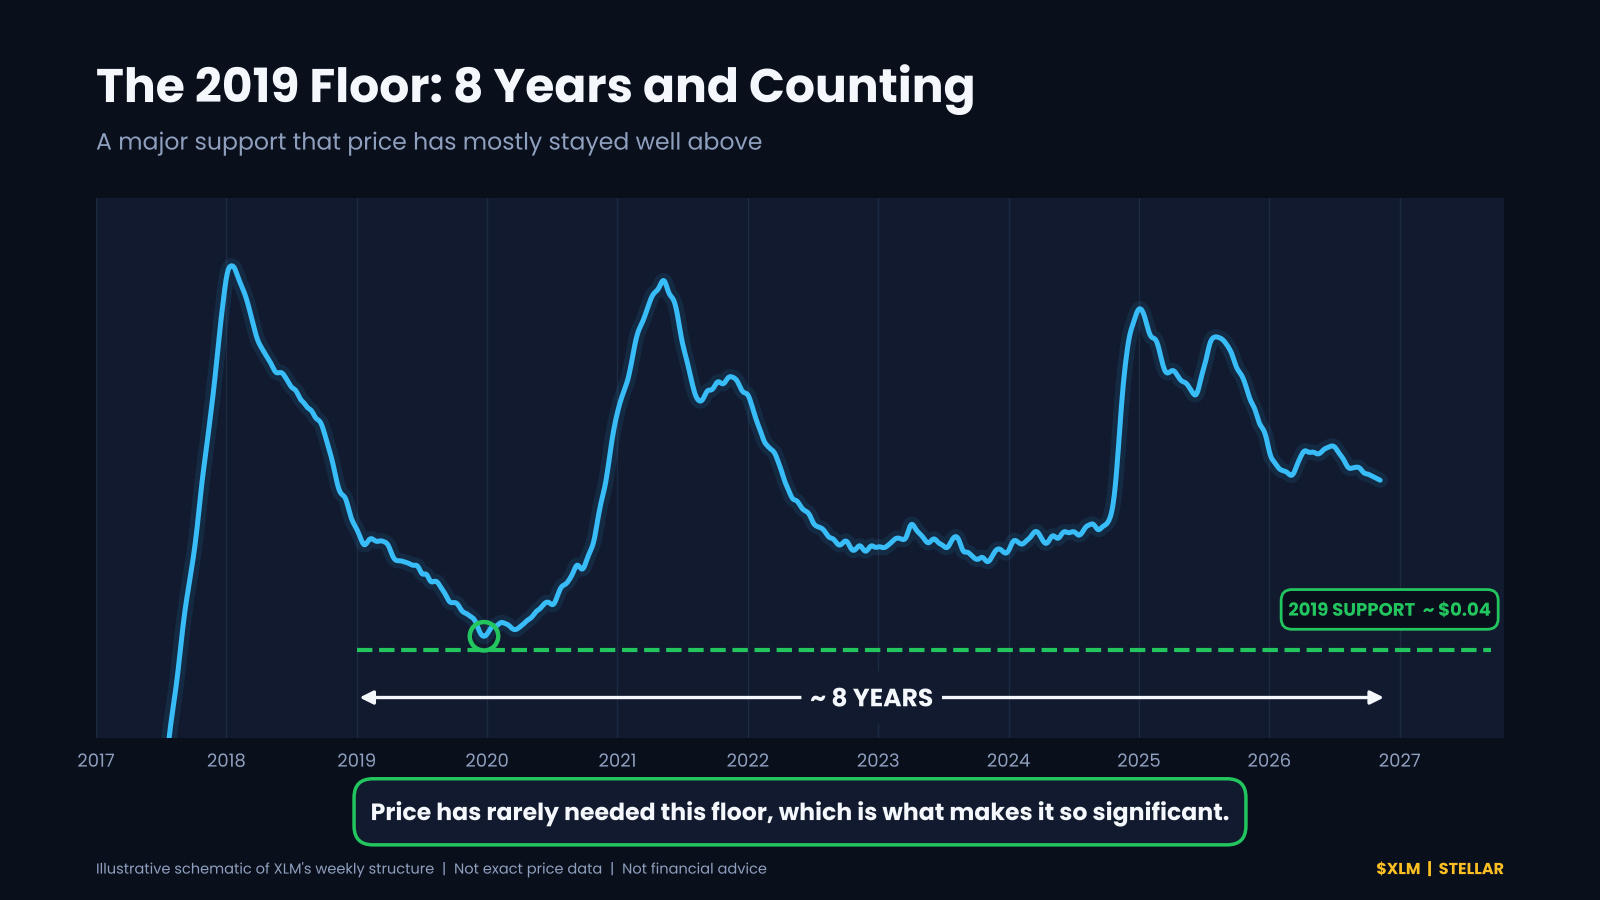
3. The 2019 Support: Eight Years and Still Standing
The support zone established in 2019 has remained intact for roughly eight years. Notably, price has usually stayed well above this level instead of testing it repeatedly, which makes it a major long-term floor. However, the current market structure raises the question of whether XLM could be headed for another significant decline this year.
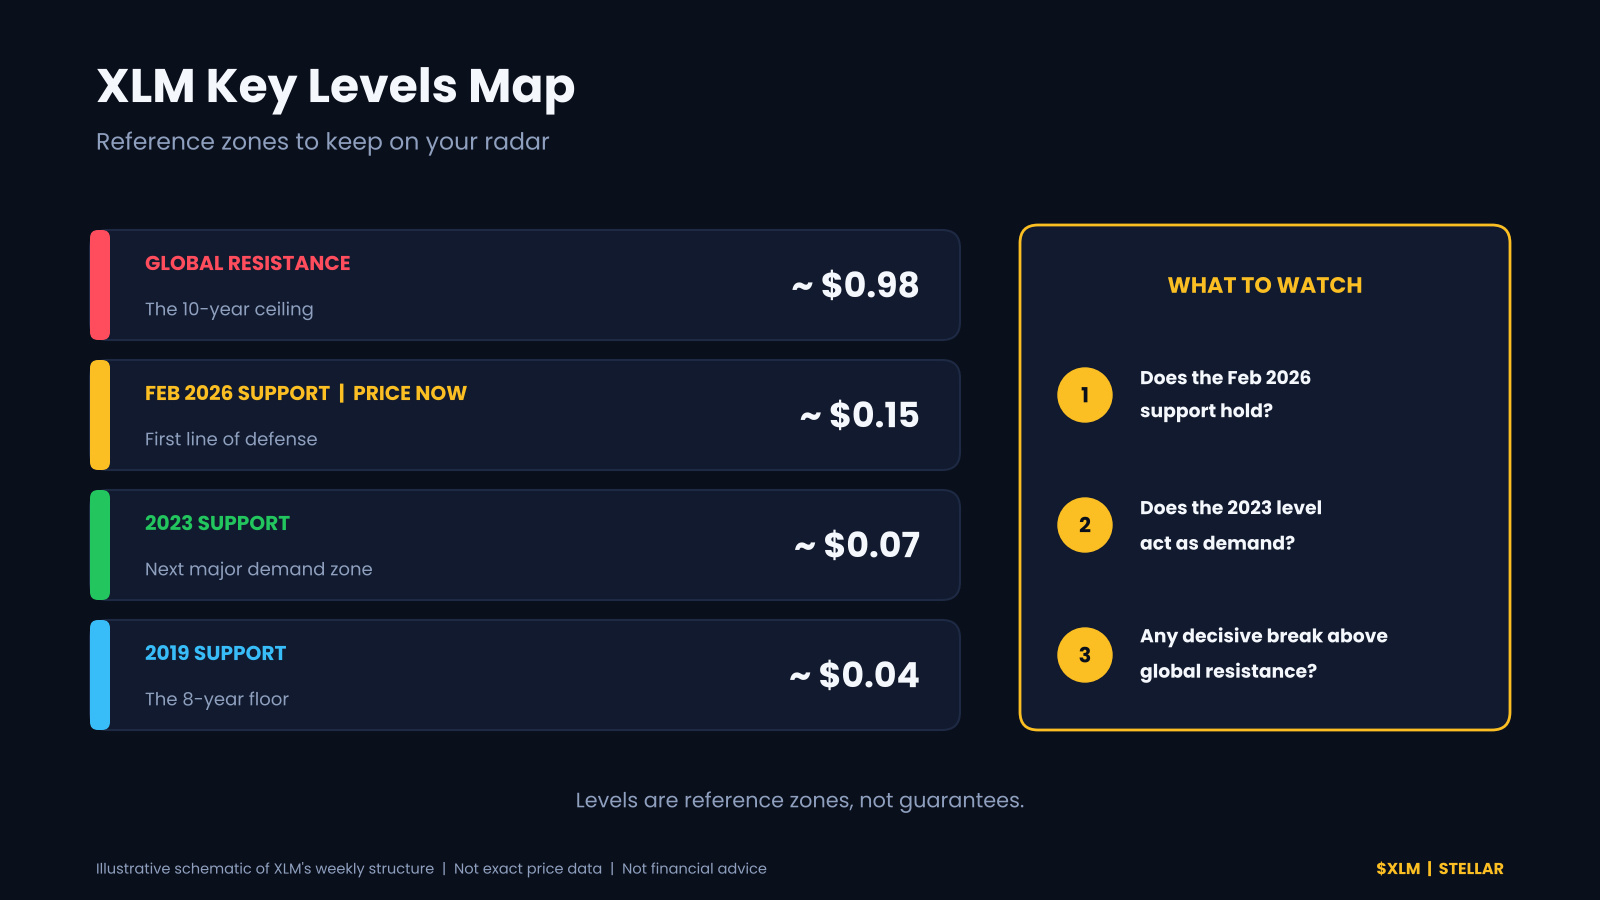
4. The 2023 Internal Support
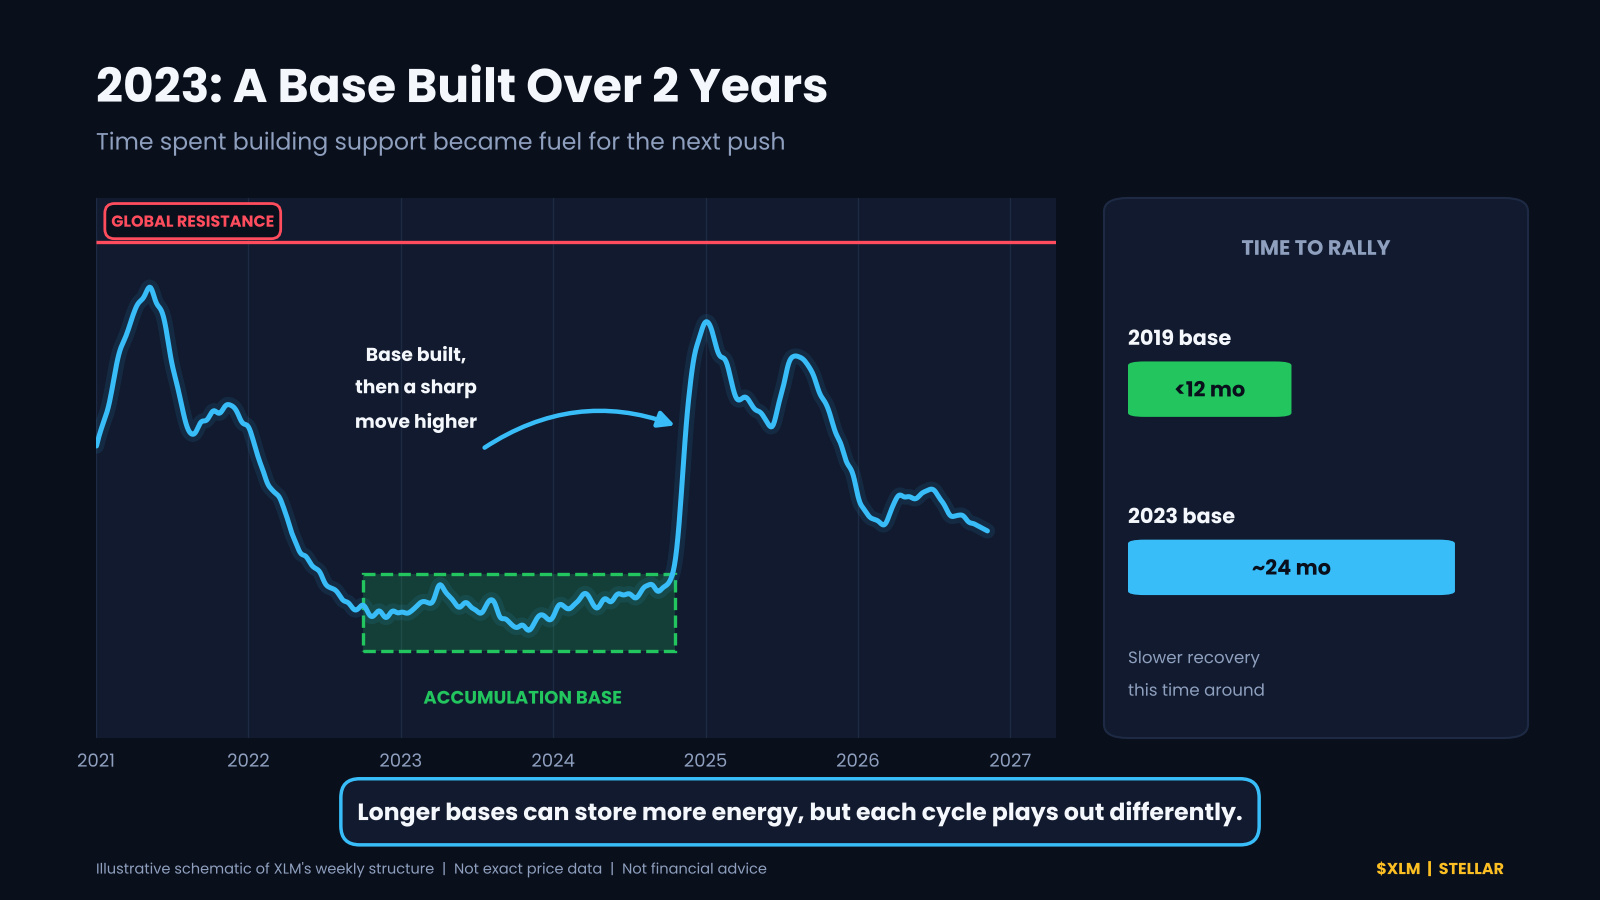
In 2023, a new internal support zone formed. Over the following two years, it built enough strength to carry price back toward the global resistance. Interestingly, a similar move in 2019 took less than 12 months, so the recovery this time was slower by comparison.
5. February 2026: A More Fragile Support
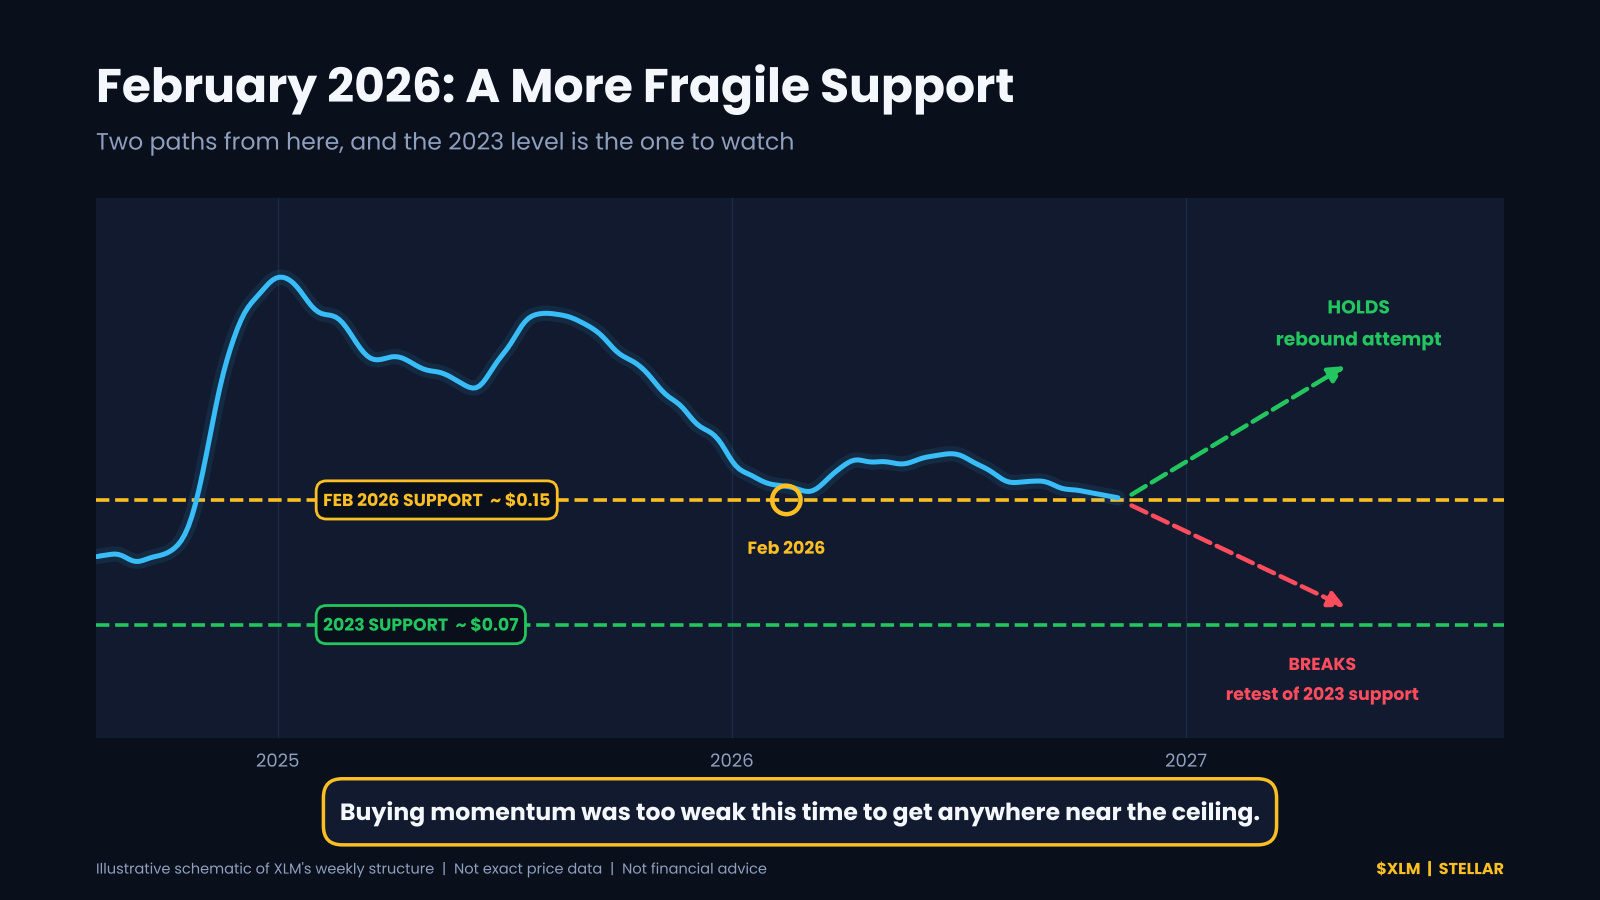
Another internal support formed in February 2026, but it looks weaker than the previous one. Current price action suggests a possible move back toward the 2023 support level. This time, the market failed to generate enough buying momentum to bring XLM anywhere near its global resistance.
6. Momentum Fading Despite Size
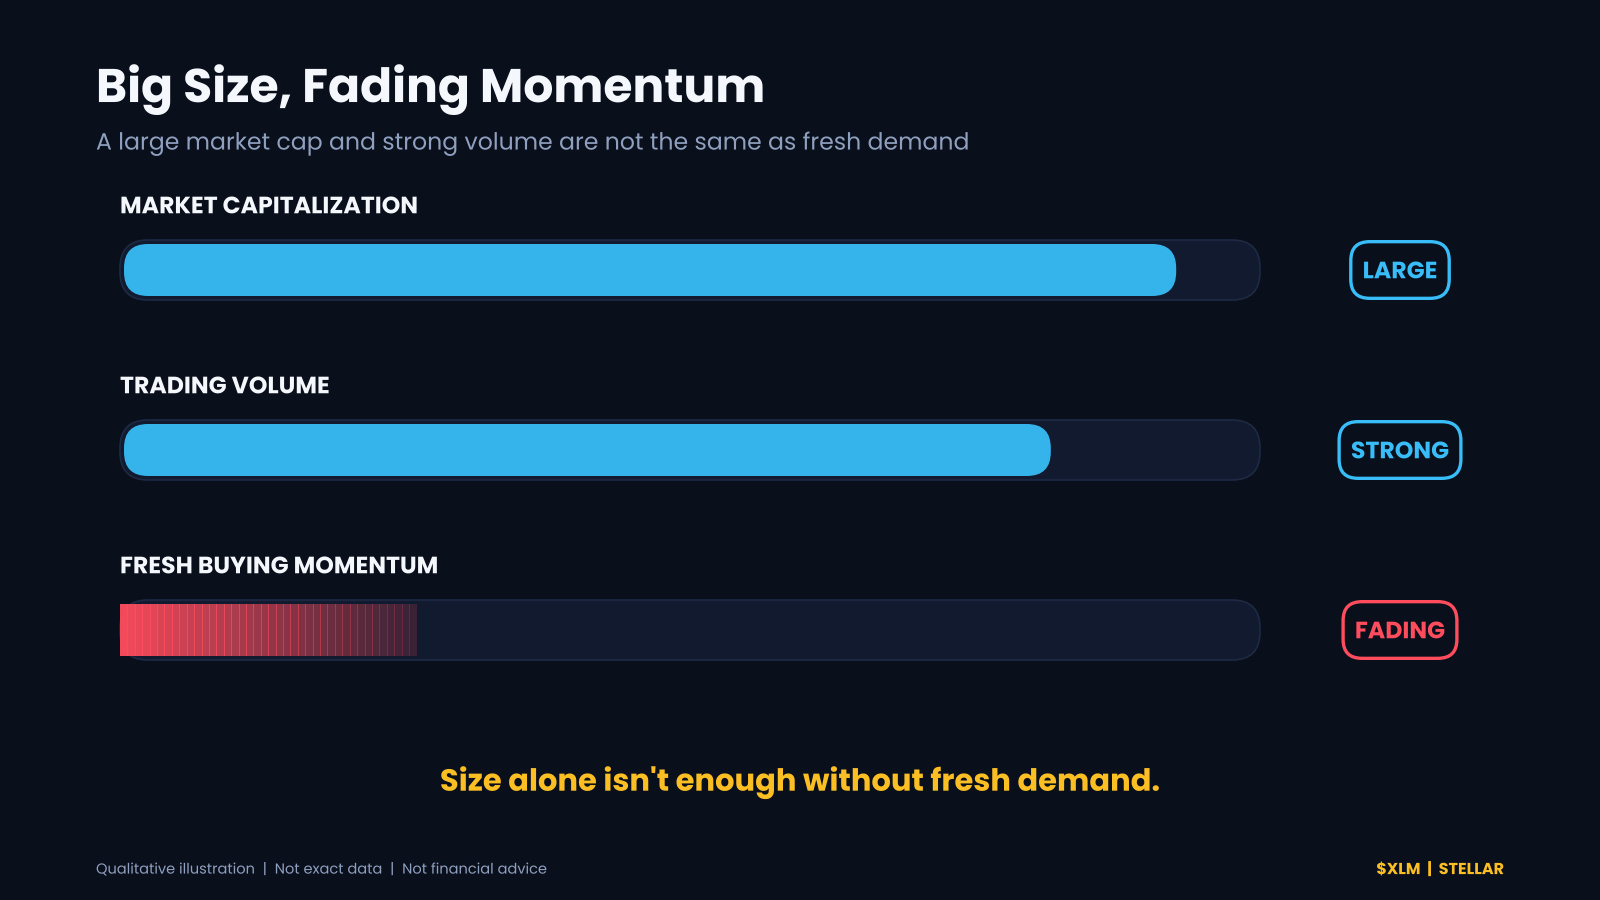
XLM still has a large market capitalization and strong trading volume, which would normally support bullish expectations. Yet over time, momentum has gradually faded instead of building. Size alone isn’t enough without fresh demand behind it.
Key Levels to Watch
Whether the February 2026 support holds
Whether the 2023 support acts as the next major demand zone
Whether a decisive breakout above the global resistance appears, which would challenge the bearish scenario
Final Thoughts
This is a technical reading of the chart, not a certainty. Markets can always surprise, and no level is guaranteed to hold. Whatever strategy you follow, solid risk management and money management are essential.
This content is for educational purposes only and is not financial advice. Always do your own research.
What’s your view on $XLM from here: will the 2023 support hold, or are we heading higher? Share your thoughts in the comments 👇
#XLM #stellar #crypto #TechnicalAnalysis