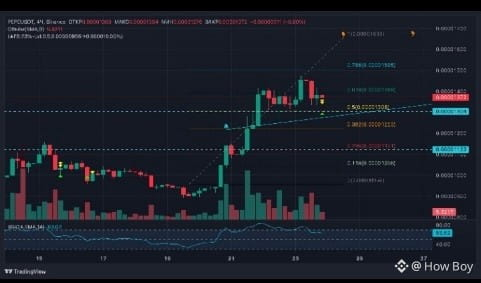
$PEPE is a highly volatile meme coin. Its price can move sharply, so technical indicators should be treated as possibilities, not guaranteed predictions.
24h high $0.000005089
24h low $0.000004845
1. Support and resistance
Level Price
Resistance 3 $0.00000598
Resistance 2 $0.00000556
Resistance 1 $0.00000520
Current price $0.000004897
Support 1 $0.00000482
Support 2 $0.00000458
Support 3 $0.00000431
2. Technical indicators explained
RSI: 55.9 – Momentum is slightly positive, not overbought.
MACD: Bullish signal in the latest technical reading.
Moving averages: Price remains above several major moving averages.
Volume: Recent trading activity has weakened, so a recovery needs stronger buying interest.
3. Possible market scenarios
If PEPE moves above $0.00000520 and holds that level, it could test $0.00000556.
If PEPE falls below $0.00000482, the next support areas to watch are $0.00000458 and $0.00000431.
4. Final explanation
PEPE's bigger trend has shown strength over the past month, but its short-term price action is showing weakness.#JobsReportRaisesHikeOdds #CPITestsDecemberRateOutlook #crypto #WillAnthropicListOnTime #WillUS-IranTensionsBoostSafe-HavenDemand?
24h high $0.000005089
24h low $0.000004845
1. Support and resistance
Level Price
Resistance 3 $0.00000598
Resistance 2 $0.00000556
Resistance 1 $0.00000520
Current price $0.000004897
Support 1 $0.00000482
Support 2 $0.00000458
Support 3 $0.00000431
2. Technical indicators explained
RSI: 55.9 – Momentum is slightly positive, not overbought.
MACD: Bullish signal in the latest technical reading.
Moving averages: Price remains above several major moving averages.
Volume: Recent trading activity has weakened, so a recovery needs stronger buying interest.
3. Possible market scenarios
If PEPE moves above $0.00000520 and holds that level, it could test $0.00000556.
If PEPE falls below $0.00000482, the next support areas to watch are $0.00000458 and $0.00000431.
4. Final explanation
PEPE's bigger trend has shown strength over the past month, but its short-term price action is showing weakness.#JobsReportRaisesHikeOdds #CPITestsDecemberRateOutlook #crypto #WillAnthropicListOnTime #WillUS-IranTensionsBoostSafe-HavenDemand?