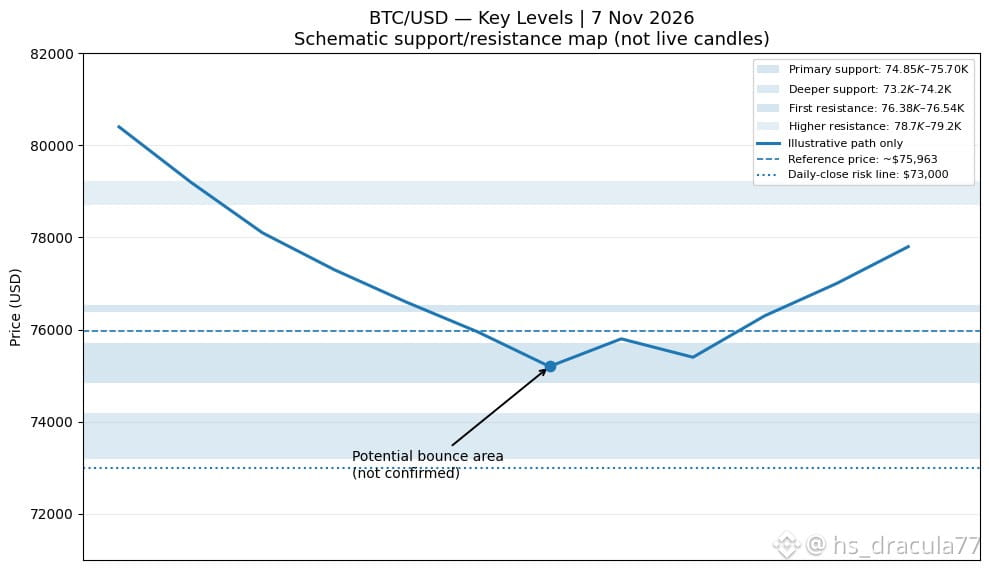
$BTC is currently trading around $75,963 (November 7, 2026). The important area to watch for a potential rebound is $74,850–$75,700. A deeper support zone sits around $73,200–$74,200. FullSwing AI +2
### BTC support and resistance chart
Key bounce zone identified
View / download the BTC technical chart
Important BTC price levels
Primary support
$74,850–$75,700
Secondary support
$73,200–$74,200
Resistance 1
$76,377–$76,544
Resistance 2
$78,700–$79,220
Major resistance
$80,000–$84,000
Levels are approximate and can change with new market candles.
### Binance Square — Ready-to-publish English post
🚨 BITCOIN (BTC): WHERE COULD THE NEXT REBOUND HAPPEN?
$BTC is currently trading near $75,963, and the market is approaching a critical support area.
📊 KEY SUPPORT ZONES:
🟢 First Support: $74,850 – $75,700
🟢 Second Support: $73,200 – $74,200
If buyers defend the first support zone and create a strong bullish reaction, BTC could attempt a recovery.
🎯 UPSIDE TARGETS:
1. $76,500 – First resistance
2. $78,700 – $79,200 – Second resistance
3. $80,000 – Major psychological level
⚠️ BEARISH SCENARIO:
If $BTC loses $74,850, selling pressure could push the price toward the $73,200–$74,200 demand zone.
A daily candle close below $73,000 would significantly weaken the bullish recovery scenario.
📈 MY TECHNICAL VIEW:
I am watching the $74,850–$75,700 zone closely.
However, I would prefer to see a liquidity sweep, strong bullish rejection, and a confirmed lower-timeframe structure shift before considering a long position.
No confirmation = No trade.
What do you think?
Will BTC bounce from $75K, or are we heading toward $73K?
#Bitcoin #BTC #CryptoAnalysis #BinanceSquare #BitcoinPrediction #CryptoTrading #TechnicalAnalysis
### My trading view
* Don't blindly enter a long at $75K.
* Watch the 15-minute and 1-hour candles for bullish confirmation.
* If BTC closes below $73K on the daily timeframe, reconsider the bullish setup.
* The 4-hour structure is currently bearish.
### BTC support and resistance chart
Key bounce zone identified
View / download the BTC technical chart
Important BTC price levels
Primary support
$74,850–$75,700
Secondary support
$73,200–$74,200
Resistance 1
$76,377–$76,544
Resistance 2
$78,700–$79,220
Major resistance
$80,000–$84,000
Levels are approximate and can change with new market candles.
### Binance Square — Ready-to-publish English post
🚨 BITCOIN (BTC): WHERE COULD THE NEXT REBOUND HAPPEN?
$BTC is currently trading near $75,963, and the market is approaching a critical support area.
📊 KEY SUPPORT ZONES:
🟢 First Support: $74,850 – $75,700
🟢 Second Support: $73,200 – $74,200
If buyers defend the first support zone and create a strong bullish reaction, BTC could attempt a recovery.
🎯 UPSIDE TARGETS:
1. $76,500 – First resistance
2. $78,700 – $79,200 – Second resistance
3. $80,000 – Major psychological level
⚠️ BEARISH SCENARIO:
If $BTC loses $74,850, selling pressure could push the price toward the $73,200–$74,200 demand zone.
A daily candle close below $73,000 would significantly weaken the bullish recovery scenario.
📈 MY TECHNICAL VIEW:
I am watching the $74,850–$75,700 zone closely.
However, I would prefer to see a liquidity sweep, strong bullish rejection, and a confirmed lower-timeframe structure shift before considering a long position.
No confirmation = No trade.
What do you think?
Will BTC bounce from $75K, or are we heading toward $73K?
#Bitcoin #BTC #CryptoAnalysis #BinanceSquare #BitcoinPrediction #CryptoTrading #TechnicalAnalysis
### My trading view
* Don't blindly enter a long at $75K.
* Watch the 15-minute and 1-hour candles for bullish confirmation.
* If BTC closes below $73K on the daily timeframe, reconsider the bullish setup.
* The 4-hour structure is currently bearish.