Bitcoin's weekly chart is flashing a pattern we've seen before.
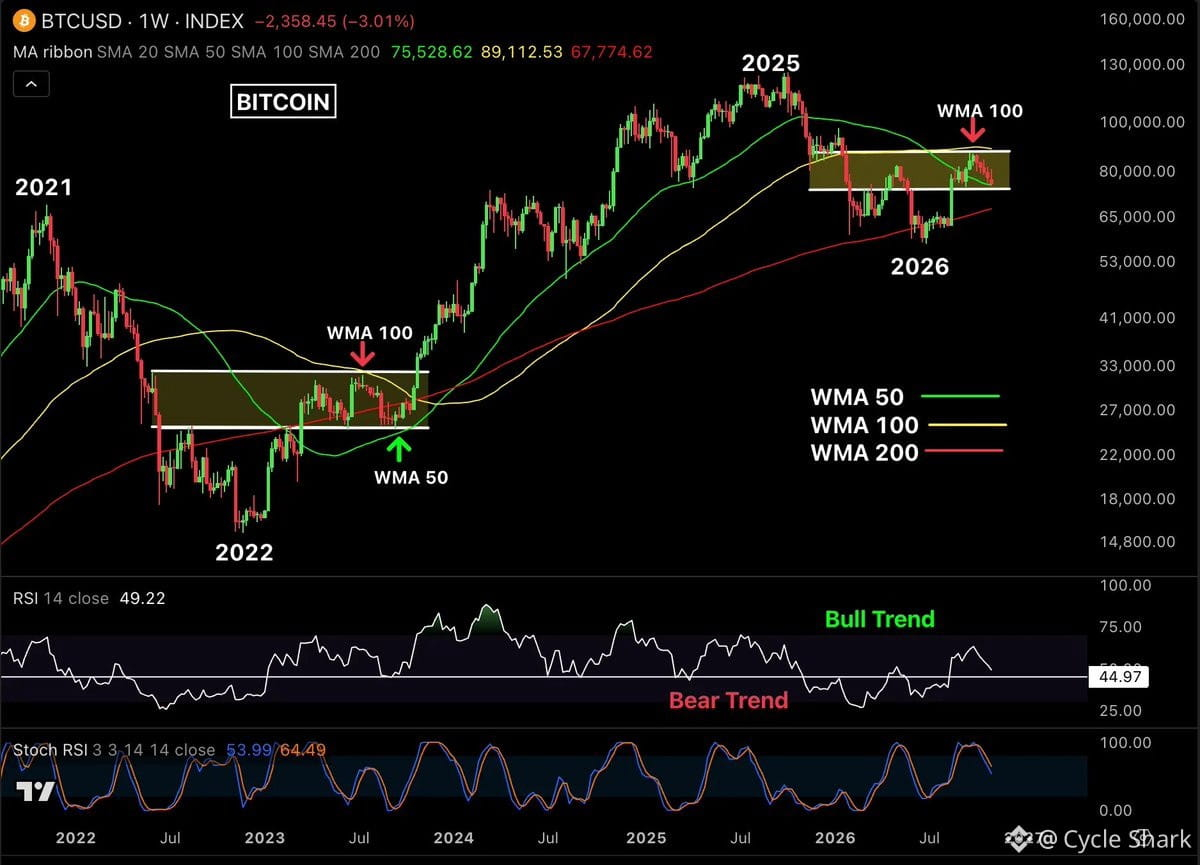
Back in 2023, $BTC spent weeks grinding between the 50-week and 100-week moving averages before finally breaking out and kicking off its next big run. Now in 2026, we're seeing the same setup play out again. Bitcoin got rejected near $87,400 at the weekly MA 100 and is now trading back between those two key levels.
Here's the technical picture:
Support sits at the weekly MA 50 around $75,500, with deeper support at the MA 200 near $67,800. On the upside, $82,000 is the first resistance, then the weekly MA 100 at $87,400. RSI is hovering near 50 — still comfortably above bear market territory — but the Stochastic RSI looks weak, suggesting RSI could dip toward 44 before any meaningful bounce.
The 2023 parallel is striking. If Bitcoin can reclaim and hold above the weekly MA 100, history suggests another major rally could follow. But that's a big if. Right now, the focus is on whether support holds. If it doesn't, we could see a deeper retest before any real upside momentum returns.
Consolidation phases like this are where conviction gets tested. The setup is there, but the breakout isn't guaranteed yet.
Back in 2023, $BTC spent weeks grinding between the 50-week and 100-week moving averages before finally breaking out and kicking off its next big run. Now in 2026, we're seeing the same setup play out again. Bitcoin got rejected near $87,400 at the weekly MA 100 and is now trading back between those two key levels.
Here's the technical picture:
Support sits at the weekly MA 50 around $75,500, with deeper support at the MA 200 near $67,800. On the upside, $82,000 is the first resistance, then the weekly MA 100 at $87,400. RSI is hovering near 50 — still comfortably above bear market territory — but the Stochastic RSI looks weak, suggesting RSI could dip toward 44 before any meaningful bounce.
The 2023 parallel is striking. If Bitcoin can reclaim and hold above the weekly MA 100, history suggests another major rally could follow. But that's a big if. Right now, the focus is on whether support holds. If it doesn't, we could see a deeper retest before any real upside momentum returns.
Consolidation phases like this are where conviction gets tested. The setup is there, but the breakout isn't guaranteed yet.