



VET's latest rebound followed a sharp intraday dip, but the wider daily chart still shows a prolonged decline.
The three wave advance does not establish a durable bottom and there remains a possibility that the next move will be down.
A break above $0.0076 would offer an early bullish signal, while the 0.005-0.007 range remains crucial support.
VET recovery outlook remains uncertain as the recent rebound fails to establish a convincing change in direction. The daily chart still shows a prolonged decline, while buyers face several price tests.
Three waves do not confirm a market bottom
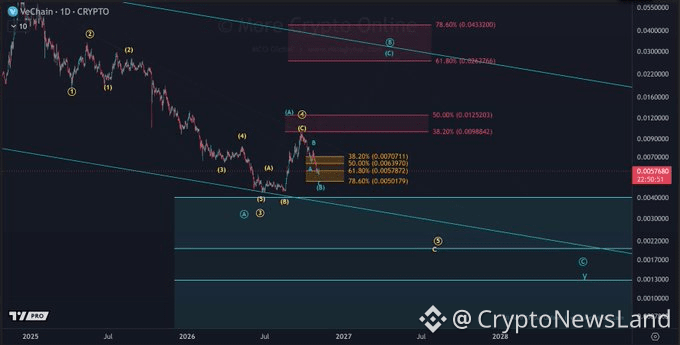
More Crypto Online questions whether VET's latest advance marks the end of its decline. The analyst points to a three-wave rise, which does not confirm a lasting low. From Elliott Wave theory, it is a possibility that the following can be a correction in Elliott Wave form.
 Source: X
That's an important distinction because corrective rallies frequently happen in the middle of down trends. They are able to raise prices without influencing the overall trend of the market. A stronger upward sequence would provide firmer evidence that selling pressure had eased.
The daily chart shows VET trading well below its earlier highs. A descending trendline also runs above the recent price action. Previous recovery attempts have failed to produce a sustained break through that resistance.
The market data as of writing places VET at $0.005811, with a 1.17% daily gain. The market-cap of it is approximately $499.68m. The 24-hour trading volume is up 45.85% to around $11.6 million.
The 0.005-0.007 range remains under watch
The 0.005–0.0057 region is the main support area identified in the analysis. VET currently trades just above its upper boundary. A decline into this range would test whether buyers are willing to defend those prices.
Several Fibonacci levels offer additional reference points around the recent recovery. The chart marks levels near $0.007071, $0.006397, $0.005787 and $0.005018. These prices may attract buying or selling as VET moves through the range.
The $0.005787 level sits particularly close to the latest market price. A sustained move beneath it could expose the lower support levels. However, a brief drop would not establish that the entire support zone had failed.
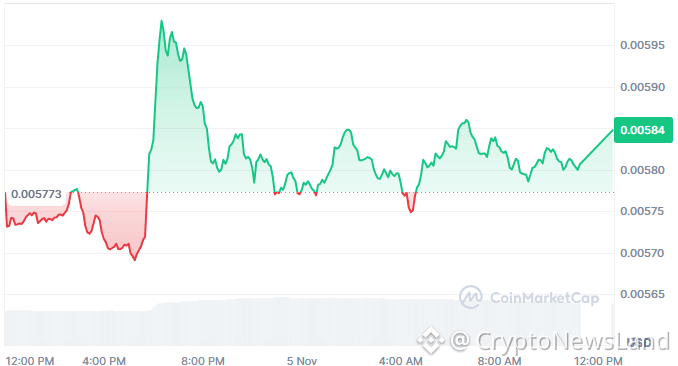
The intraday chart shows how quickly buying interest returned after an earlier decline. VET slipped toward $0.00569 before climbing close to $0.00597. It went back and forth and settled into a trading range within $0.00575 and $0.00585 for several hours.
 Source: Coinmarketcap A move above $0.0076 could improve the chart
The $0.0076 level is the first upside threshold identified in the analysis. A decisive break above it would provide an early sign of improving market conditions. It could also bring higher Fibonacci levels into view as potential resistance.
Even so, crossing that level would not settle the wider Elliott Wave count. Traders would still need to examine the structure of the next advance. Higher highs and higher lows would offer stronger evidence of a sustained recovery.
The consequences of losing support are considerably different. However, a drop below $0.005 would leave VET vulnerable to further losses. Still, the wider chart also supplies prospective downside levels around $0.0017 and $0.0013, which are still longer term estimates.
Those lower levels should not be confused with immediate price targets. The nearer test remains whether VET can hold the 0.005–0.0057 range. Without that support, the recent rebound may prove to be another pause.
For now, traders face a clear divide between the two scenarios. If they hold onto the support, the buyers might have the opportunity to try once more to recover. Any action above $0.0076 would be more convincing of a trend change. Until then, the chart does not confirm that VET has reached its bottom.