$APPB APP B (AppLovin Tokenized b Stocks) – Analysis
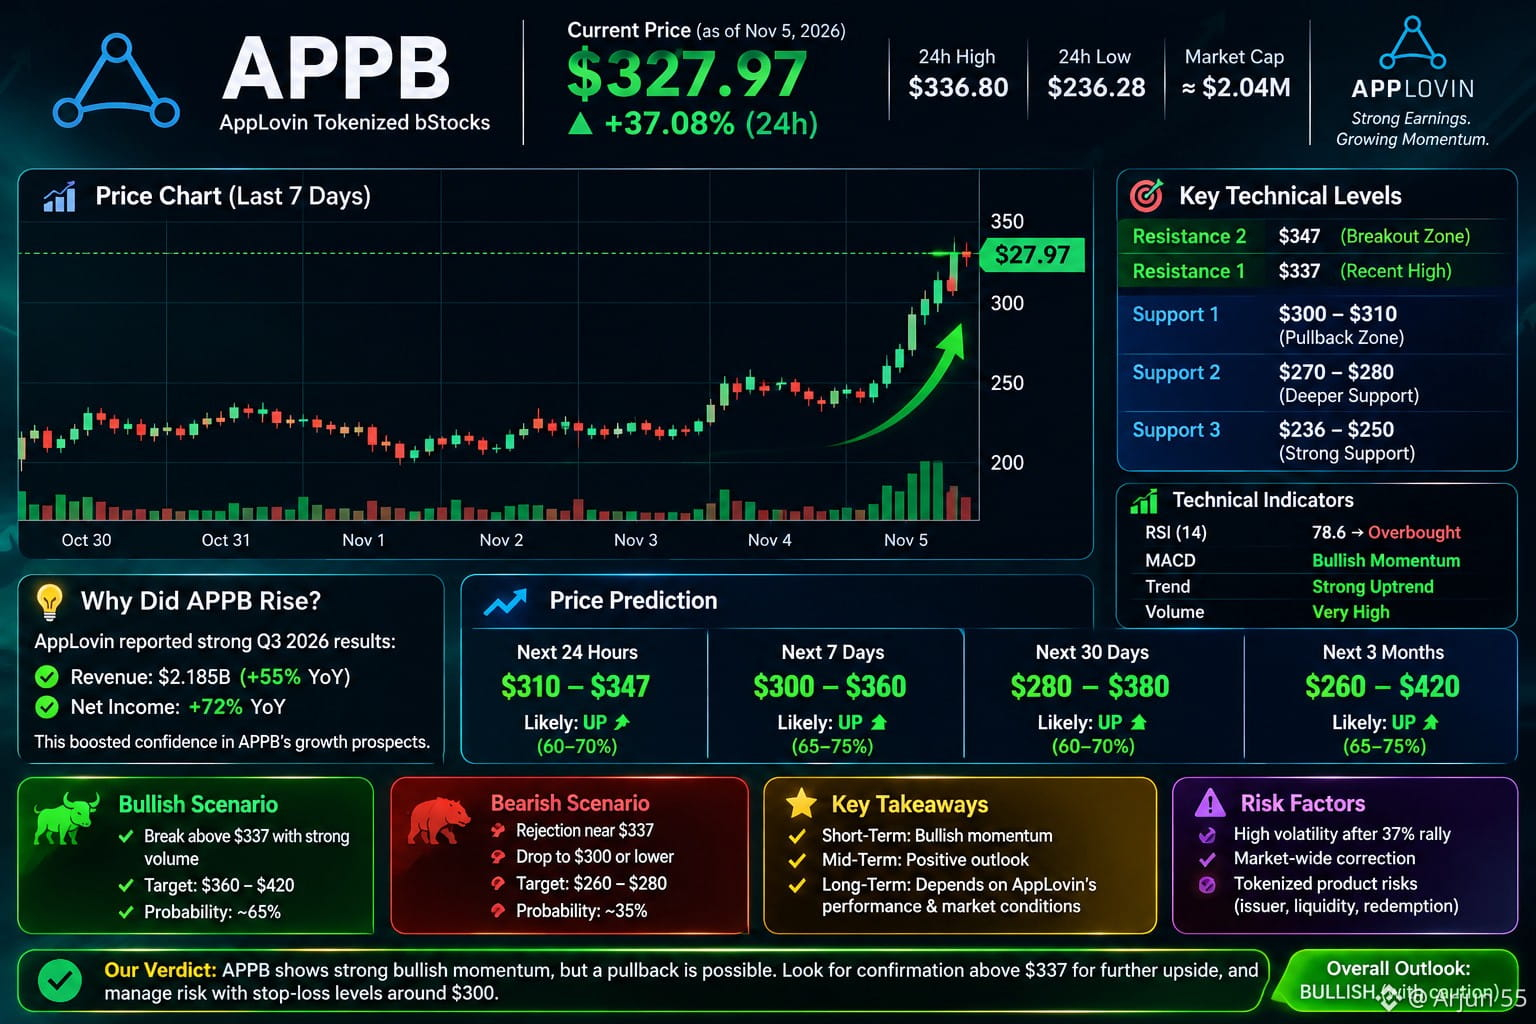
As of 5 November 2026, APP B is showing a major price movement.
Recent market movement reported price
$327.97
24h high: $336.80
24h low: $236.28 · Market cap: approximately $2.04 million
Source:
Important: Other price trackers are reporting approximately $226–$327. This is a substantial discrepancy. Confirm the APP B/USDT exchange price before trading.
Why did APP B rise
AppLovin announced strong Q3 2026 results on November 4:
Revenue: $2.185 billion.
Revenue growth: 55% year over year.
Net income growth: 72% year over year.
These are positive fundamental signals for the underlying company.
Technical levels to watch
Based on the reported trading range:
Level APP B price (USD) Importance
Resistance 2 $347 Breakout zone
Resistance 1 $337 Recent high
Support 1 $300–310 Potential pullback zone
Support 2 $270–280 Deeper correction zone
Support 3 $236–250 Recent lower range
These are provisional price zones, not confirmed technical support levels.
Future prediction
Next 24–48 hours
Bullish scenario
Holds above $310 and breaks $337 with strong volume.
Correction scenario
Rejection near $337 could lead to profit-taking toward $300 or lower.
Next 7–30 days
Direction depends on App Lovin's underlying stock performance, earnings momentum and APP B market liquidity.
My assessment: Bullish underlying fundamentals, but chasing a 37% rally is risky. I would wait for price consolidation and confirmation rather than buy immediately.
#APPB #fogo #SOXSB #CPIWatch #USJobData
As of 5 November 2026, APP B is showing a major price movement.
Recent market movement reported price
$327.97
24h high: $336.80
24h low: $236.28 · Market cap: approximately $2.04 million
Source:
Important: Other price trackers are reporting approximately $226–$327. This is a substantial discrepancy. Confirm the APP B/USDT exchange price before trading.
Why did APP B rise
AppLovin announced strong Q3 2026 results on November 4:
Revenue: $2.185 billion.
Revenue growth: 55% year over year.
Net income growth: 72% year over year.
These are positive fundamental signals for the underlying company.
Technical levels to watch
Based on the reported trading range:
Level APP B price (USD) Importance
Resistance 2 $347 Breakout zone
Resistance 1 $337 Recent high
Support 1 $300–310 Potential pullback zone
Support 2 $270–280 Deeper correction zone
Support 3 $236–250 Recent lower range
These are provisional price zones, not confirmed technical support levels.
Future prediction
Next 24–48 hours
Bullish scenario
Holds above $310 and breaks $337 with strong volume.
Correction scenario
Rejection near $337 could lead to profit-taking toward $300 or lower.
Next 7–30 days
Direction depends on App Lovin's underlying stock performance, earnings momentum and APP B market liquidity.
My assessment: Bullish underlying fundamentals, but chasing a 37% rally is risky. I would wait for price consolidation and confirmation rather than buy immediately.
#APPB #fogo #SOXSB #CPIWatch #USJobData