Today's $BTC bounce is the most interesting tape we've had all week — not because it rallied, but because of exactly where it got bought.
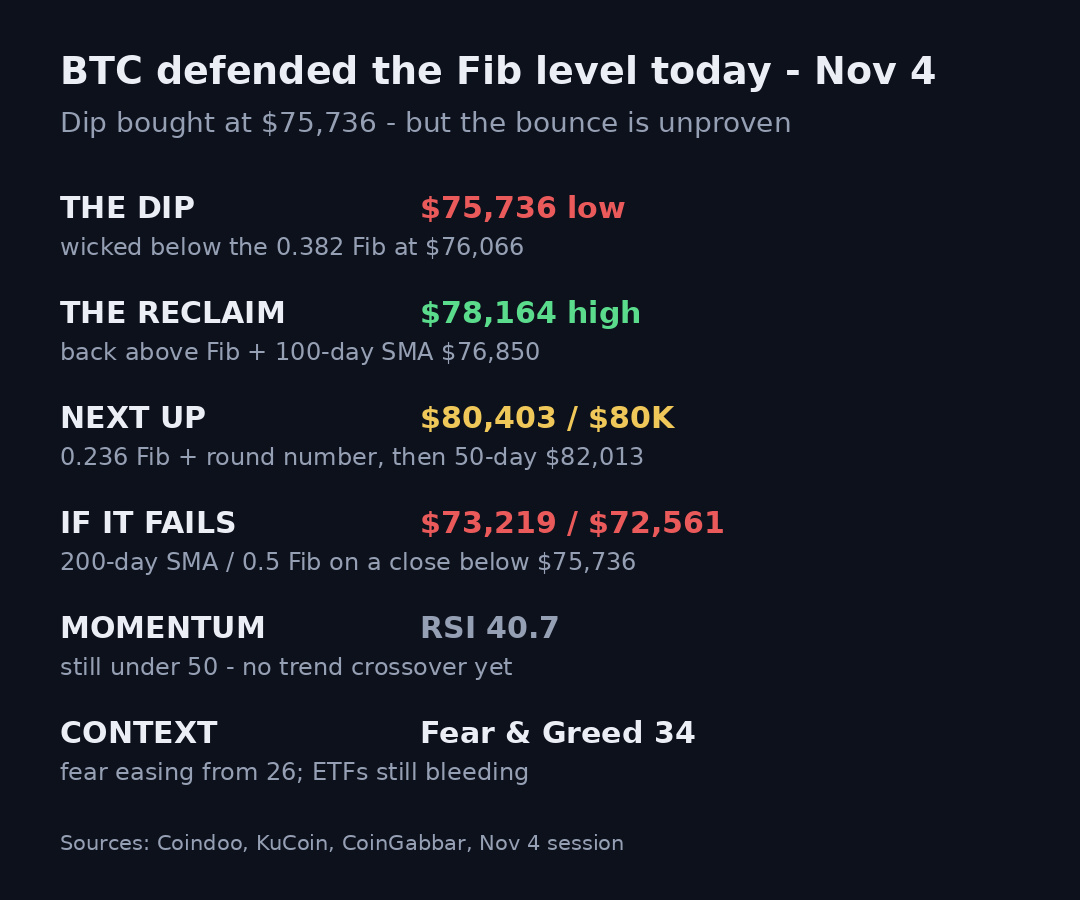
Sellers pushed price below the 100-day moving average at $76,850 and through the 0.382 Fibonacci level near $76,066, with the wick reaching $75,736. That's where buyers finally stepped in, per Coindoo's session analysis, driving a $2,428 climb back to a $78,164 high — above both the Fib level and the 100-day average again. A level getting tested, broken, and reclaimed in one session is a much stronger signal than a level that never gets touched at all.
But I'm not calling this a reversal yet, and here's why. The daily RSI sits at 40.7, still under its signal line and below the 50 midpoint — the bounce hasn't produced a momentum crossover. And the institutional backdrop is still ugly: US spot ETFs saw $398.6M of outflows on Nov 2 after $643.2M on Oct 30, over $1B across two sessions. Buyers defended a technical level; they haven't yet shown they can absorb that kind of institutional selling for days on end.
So my read is conditional, and I'll keep it simple. If price holds above the 100-day average at $76,850 and clears today's $78,164 high, the path opens toward the 0.236 Fib around $80,403 and the $80,000 round number, then the 50-day average at $82,013. If instead we get a daily close below $76,066 and the $75,736 low, today's defence was a trap and I'd be watching the 200-day average at $73,219 and the 0.5 Fib near $72,561. Fear & Greed at 34 says fear is easing from 26, but it's hardly gone — and Friday's US jobs report is the next real catalyst.
My lean: the Fib defence holds and we test $80K before we test $73K — but a close under $75,736 kills that view for me. Which side are you on: was today the floor, or just a pause before the next leg down? Not financial advice.
Sellers pushed price below the 100-day moving average at $76,850 and through the 0.382 Fibonacci level near $76,066, with the wick reaching $75,736. That's where buyers finally stepped in, per Coindoo's session analysis, driving a $2,428 climb back to a $78,164 high — above both the Fib level and the 100-day average again. A level getting tested, broken, and reclaimed in one session is a much stronger signal than a level that never gets touched at all.
But I'm not calling this a reversal yet, and here's why. The daily RSI sits at 40.7, still under its signal line and below the 50 midpoint — the bounce hasn't produced a momentum crossover. And the institutional backdrop is still ugly: US spot ETFs saw $398.6M of outflows on Nov 2 after $643.2M on Oct 30, over $1B across two sessions. Buyers defended a technical level; they haven't yet shown they can absorb that kind of institutional selling for days on end.
So my read is conditional, and I'll keep it simple. If price holds above the 100-day average at $76,850 and clears today's $78,164 high, the path opens toward the 0.236 Fib around $80,403 and the $80,000 round number, then the 50-day average at $82,013. If instead we get a daily close below $76,066 and the $75,736 low, today's defence was a trap and I'd be watching the 200-day average at $73,219 and the 0.5 Fib near $72,561. Fear & Greed at 34 says fear is easing from 26, but it's hardly gone — and Friday's US jobs report is the next real catalyst.
My lean: the Fib defence holds and we test $80K before we test $73K — but a close under $75,736 kills that view for me. Which side are you on: was today the floor, or just a pause before the next leg down? Not financial advice.