

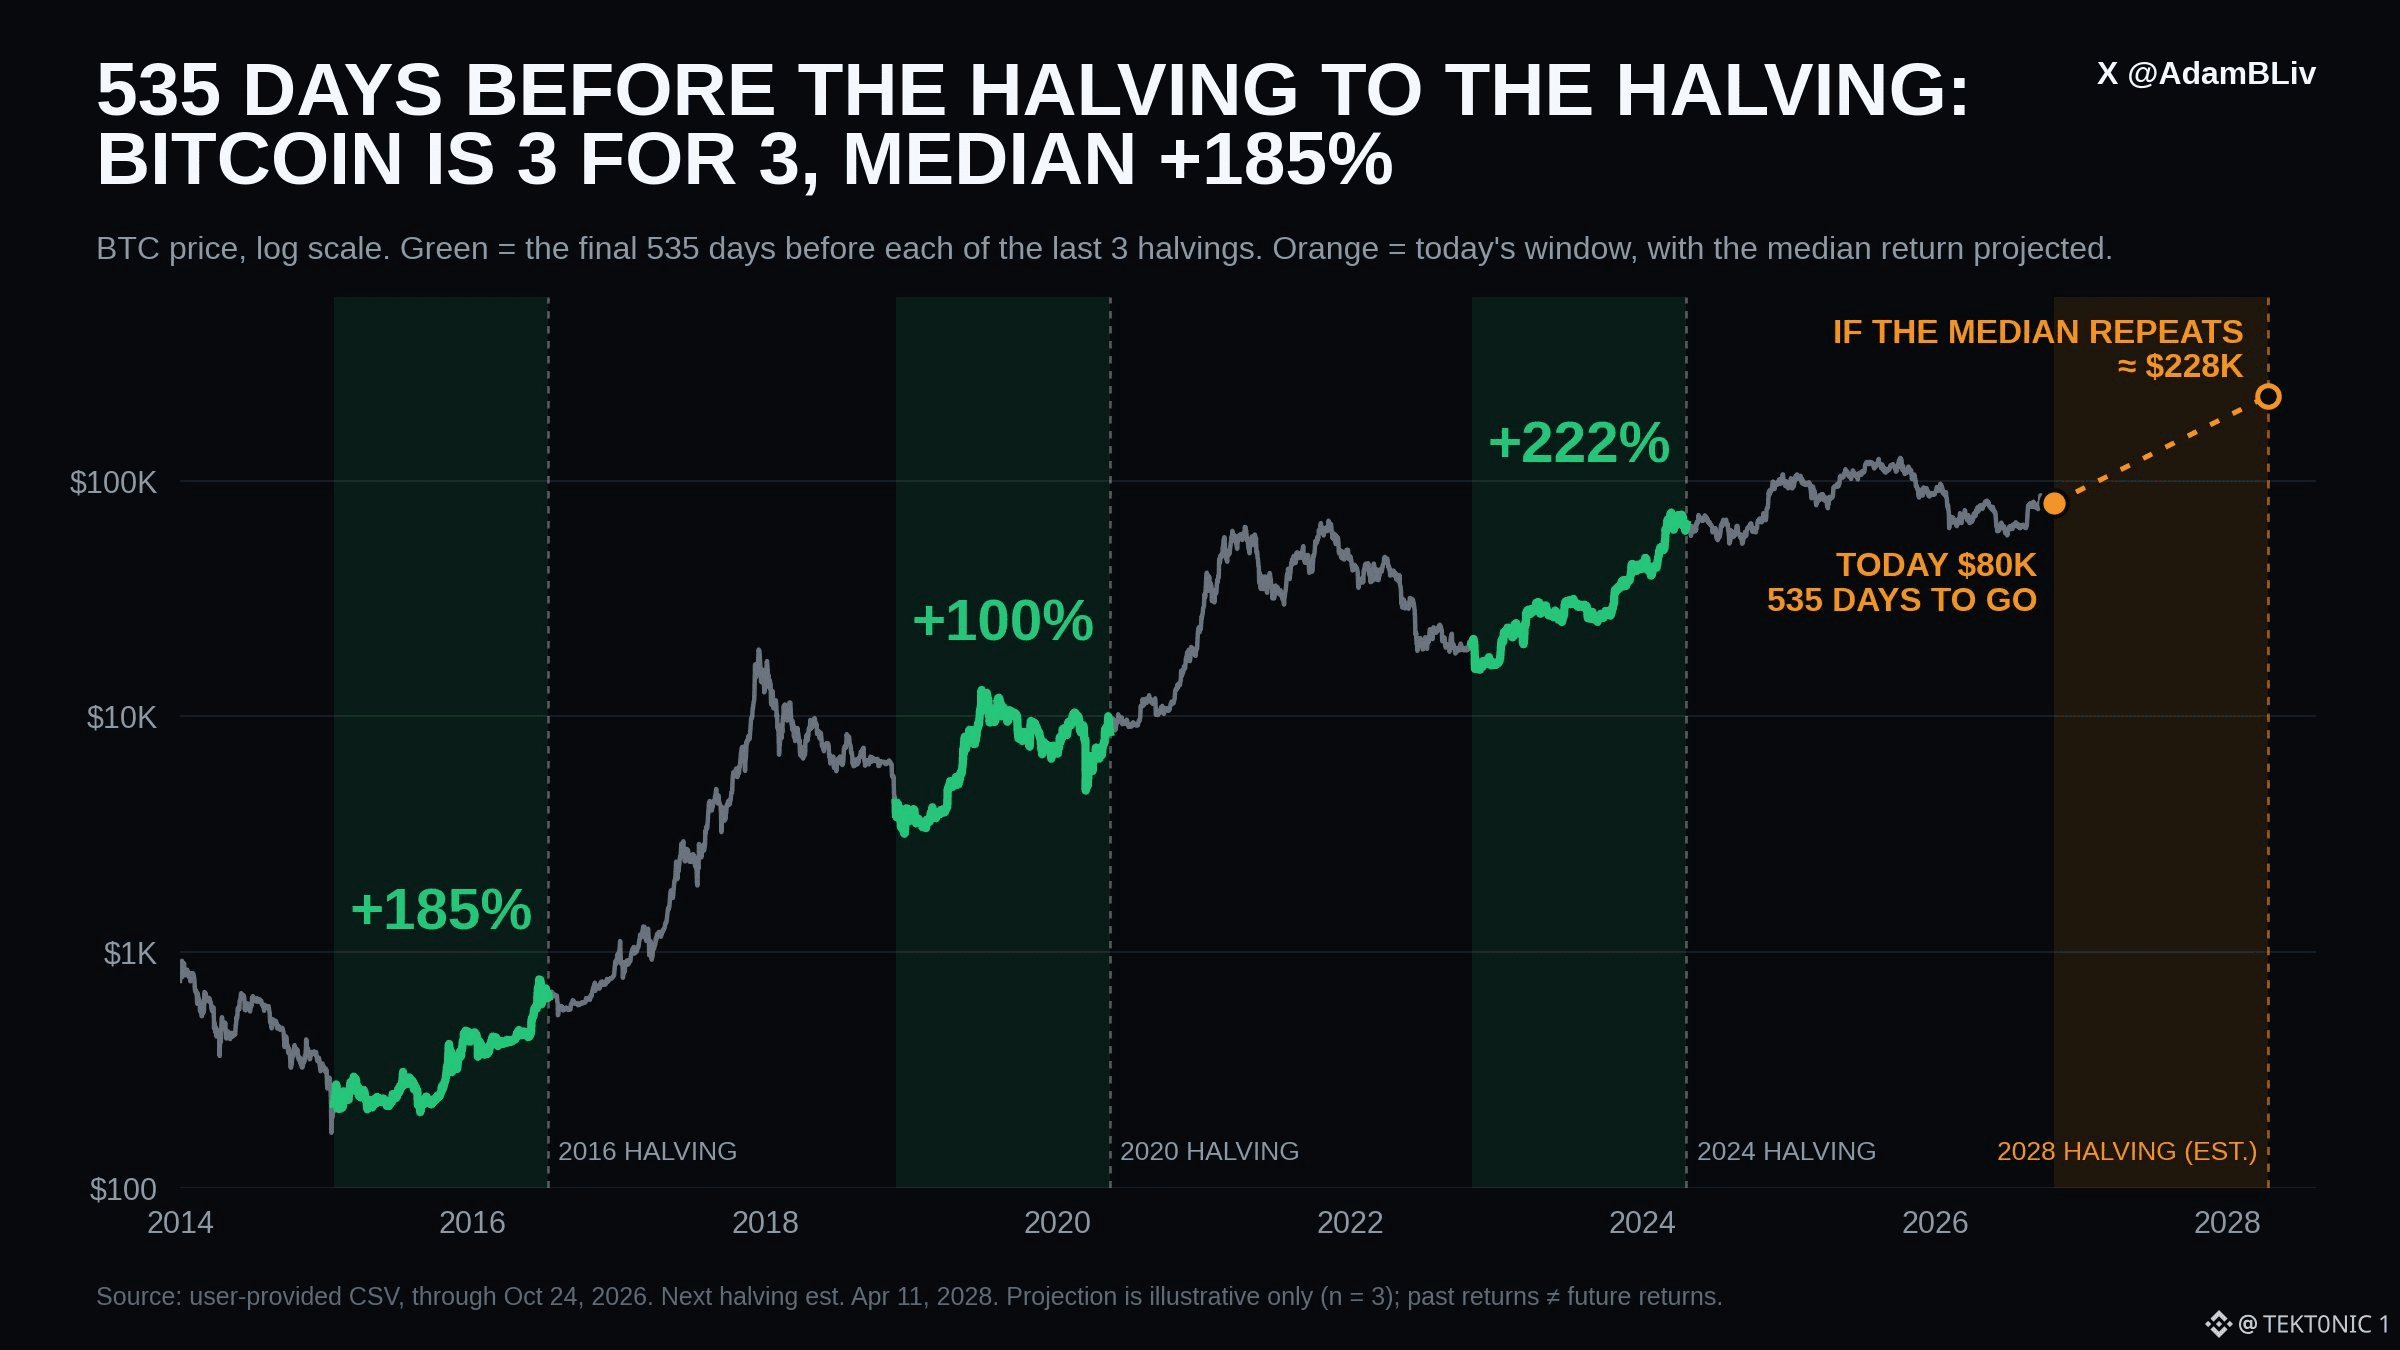
bitcoin has finished higher in the final 535 days before each of the last three halvings, with a median gain of +185%. the chart highlights those three periods in green. the stretch into the 2016 halving gained about +185%. the one into 2020 gained about +100%. the one into 2024 gained about +222%. in every case the price ended higher than where it started 535 days earlier. the orange section marks the current window. there are roughly 535 days left until the next estimated halving around april 11, 2028. if the median historical return of +185% repeated from the roughly $80k level on the chart, it would point to about $228k by then. the projection is only illustrative. it rests on three past periods, and later cycles have produced smaller percentage gains as bitcoin has grown. the pattern has held so far, but it is not a guarantee. the next thing to watch is how price behaves through the rest of this 535-day stretch. #BTC Price Analysis# #Bitcoin Price Prediction: What is Bitcoins next move?# $BTC $ETH

Join global crypto users on Binance Square
⚡️ Get latest and useful information about crypto.
💬 Trusted by the world’s largest crypto exchange.
👍 Discover real insights from verified creators.
Email / Phone number