$SPCXB : SPCXB Volume Clue
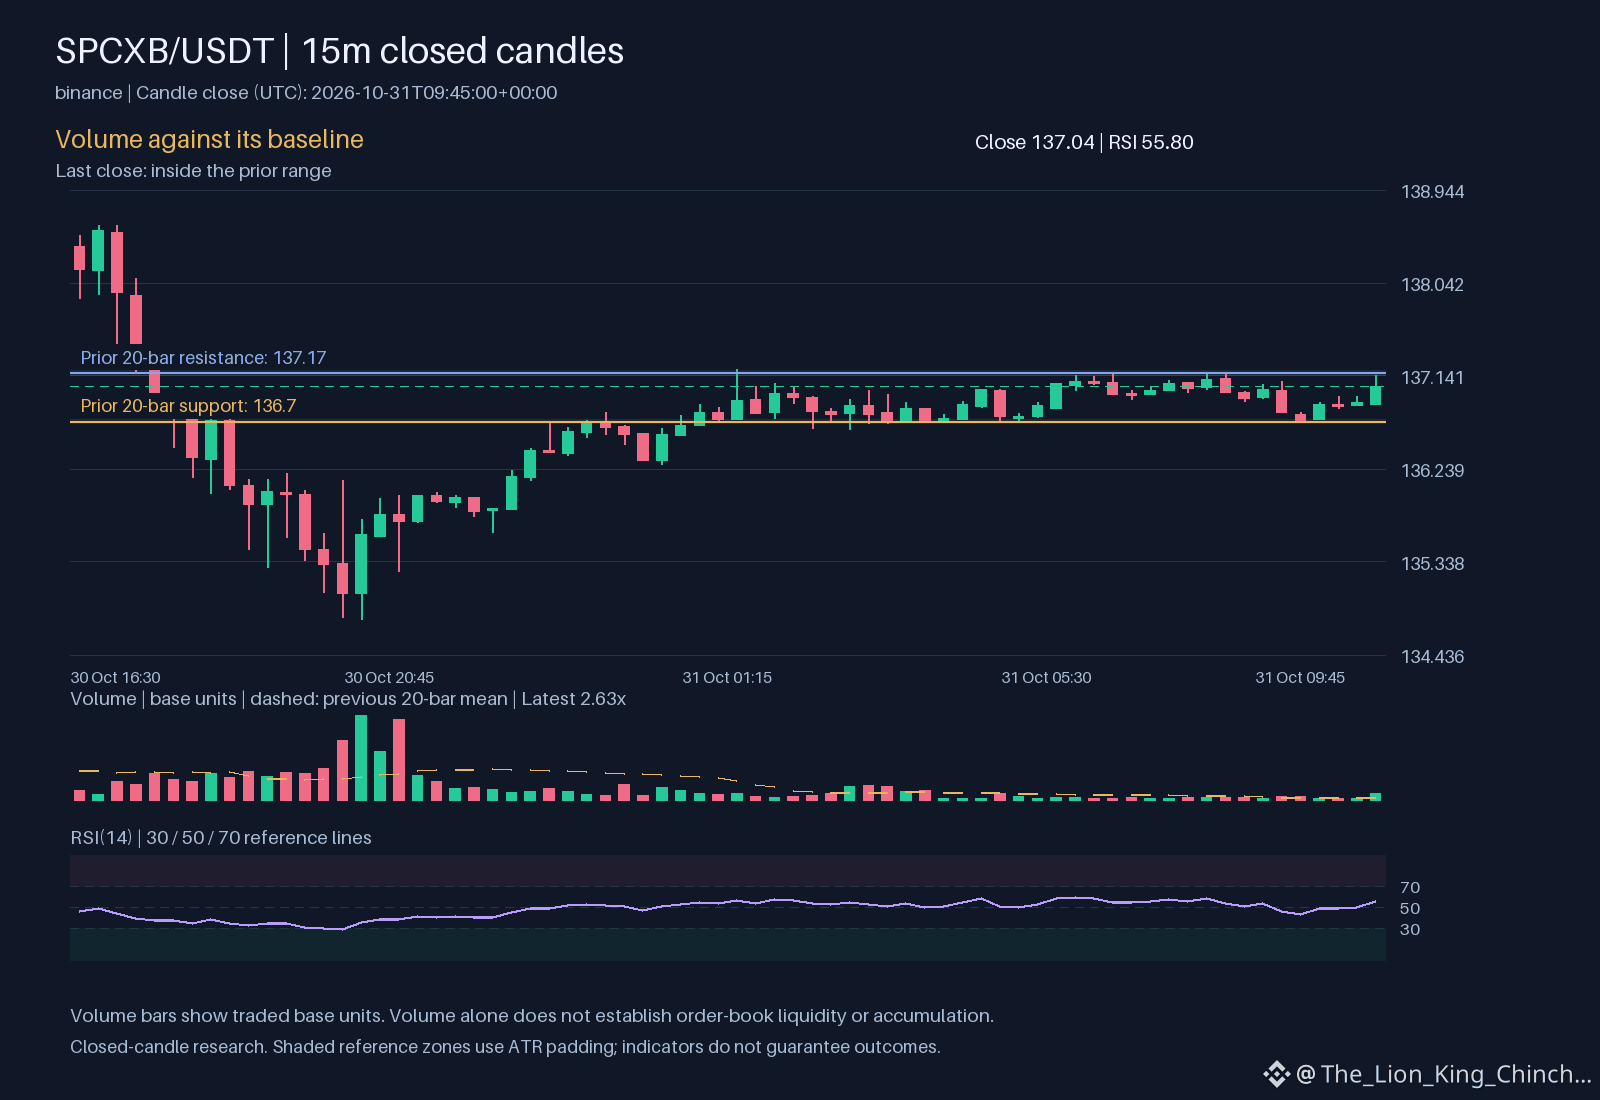
What turns a quiet start into a lasting shift? $SPCXB currently trades at 137.04 with relative volume at 2.62878. This higher activity often signals new participants entering the market. However, volume alone does not confirm direction. A strong clue is the upward hourly movement. Yet, if price slips below the support level at 136.7, this reading weakens quickly. The balance between buying and selling remains delicate.
Alternative readings focus on price structure. If the asset closes above the resistance level at 137.17, it suggests genuine demand. A lower read involves a mere test of the range. In this scenario, sellers above might absorb buying pressure. This interpretation weakens if holding occurs above the current average for the previous day, represented by 137.11. Observing stability near this point helps distinguish noise from intent.
What changes the overall perspective? A clean close above resistance offers conviction. A patient retest of support provides another chance to observe strength. If price fails to hold above 137.04 moments after a surge, the initial move may have lacked depth. Monitoring the oscillation index at 55.803 can show if buying pressure is becoming overextended. Excessive stretching often precedes a pause. Keeping an eye on these balance points avoids assuming a trend from a single candle. The real signal appears only if multiple sessions confirm the initial impede. Without that confirmation, the move remains a tentative test rather than a clear break. Patience allows the market to reveal its true intent through sustained price action rather than momentary spikes.
Probabilistic market research, not a recommendation or guaranteed return.
What would convince you: a clean close or a patient retest?
#SPCXB