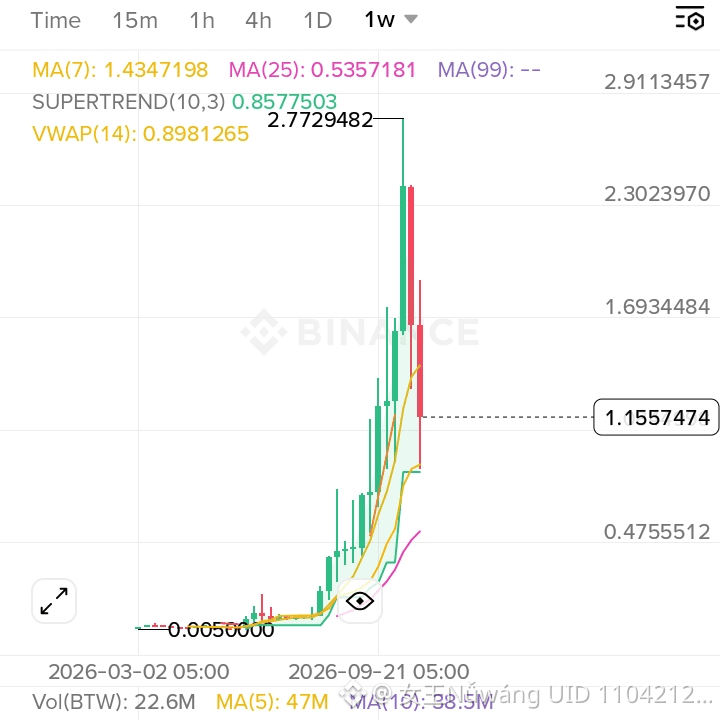
BTW Weekly Update: Cool-Down After Massive Expansion
The weekly chart for $BTW shows a significant pullback after testing highs near $2.77, currently trading around $1.15.
Market Capitalization: $3.29B
FDV: $11.28B
RSI (14): Cooling down around 58.26, reflecting easing momentum after the aggressive vertical move.
Key Moving Averages: MA(7) sits at $1.43, while the MA(25) provides deeper structural support around $0.53.
While the weekly candle reflects a sharp correction, price action is testing crucial moving average zones to establish a base. Manage your risk closely and watch for volume stabilization on lower timeframes
$BTW #BTW