

Gold Price Analysis: Can GOLD Recover After the Recent Drop?
Market Overview
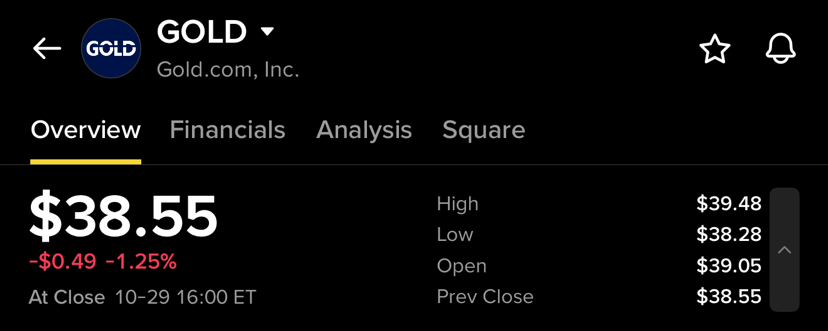
Gold (GOLD) was trading around $38.55 in the shared screenshot, showing a decline of approximately 1.25%. The chart indicates short-term selling pressure, with several red candles appearing after a brief recovery.
Technical Analysis
* Current Price: $38.55
* Resistance: $38.80–$39.00
* Support: Around $38.10–$38.30
* Trend: Short-term bearish pressure
The price is trading below several moving-average lines, suggesting that sellers currently have the advantage. If the price holds above support, a recovery may be possible. However, a break below support could lead to further downside.
What Should Traders Watch?
Traders should watch whether GOLD can recover above nearby resistance or continues to make lower lows. Confirmation from the next candles and trading volume may help clarify the direction.
Your Opinion Matters!
Do you think GOLD will recover, or will sellers push the price lower? Share your thoughts in the comments!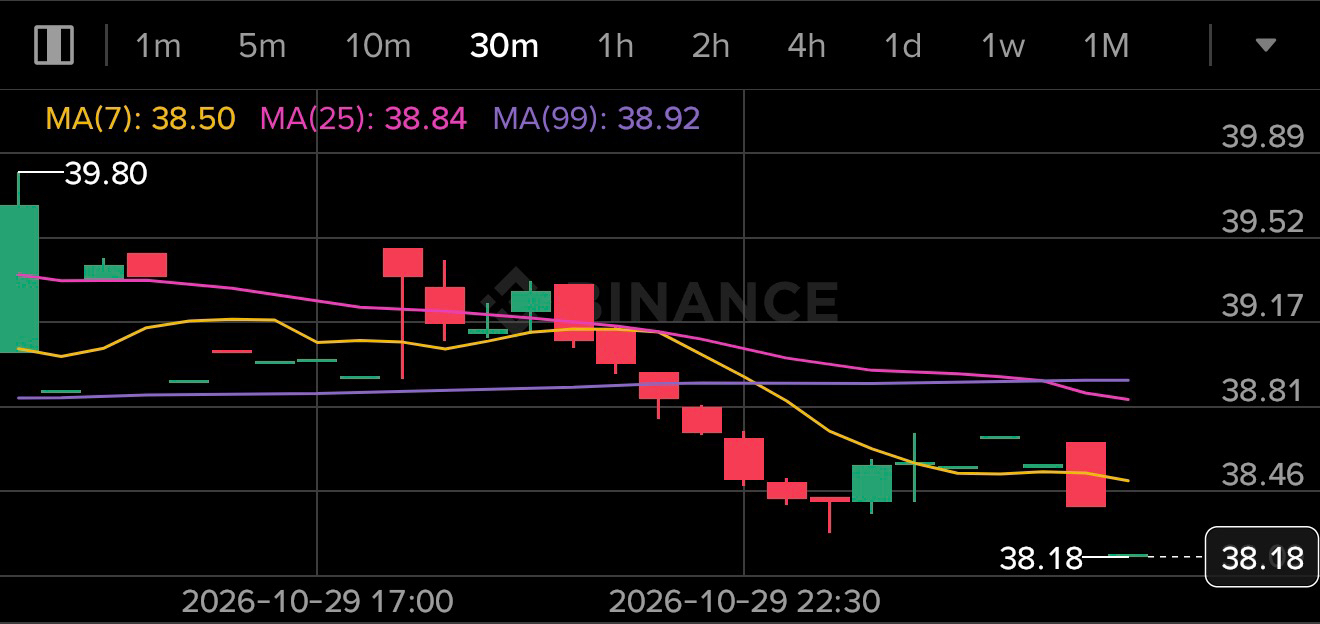 #GoldAnalysis #trading #MarketUpdate #BinanceSquare $GOLD.US
