🚨 BITCOIN REVERSAL! FROM BEARISH PRESSURE TO BULLISH BREAKOUT? 📈
₿ BTC/USDT | 30M CHART
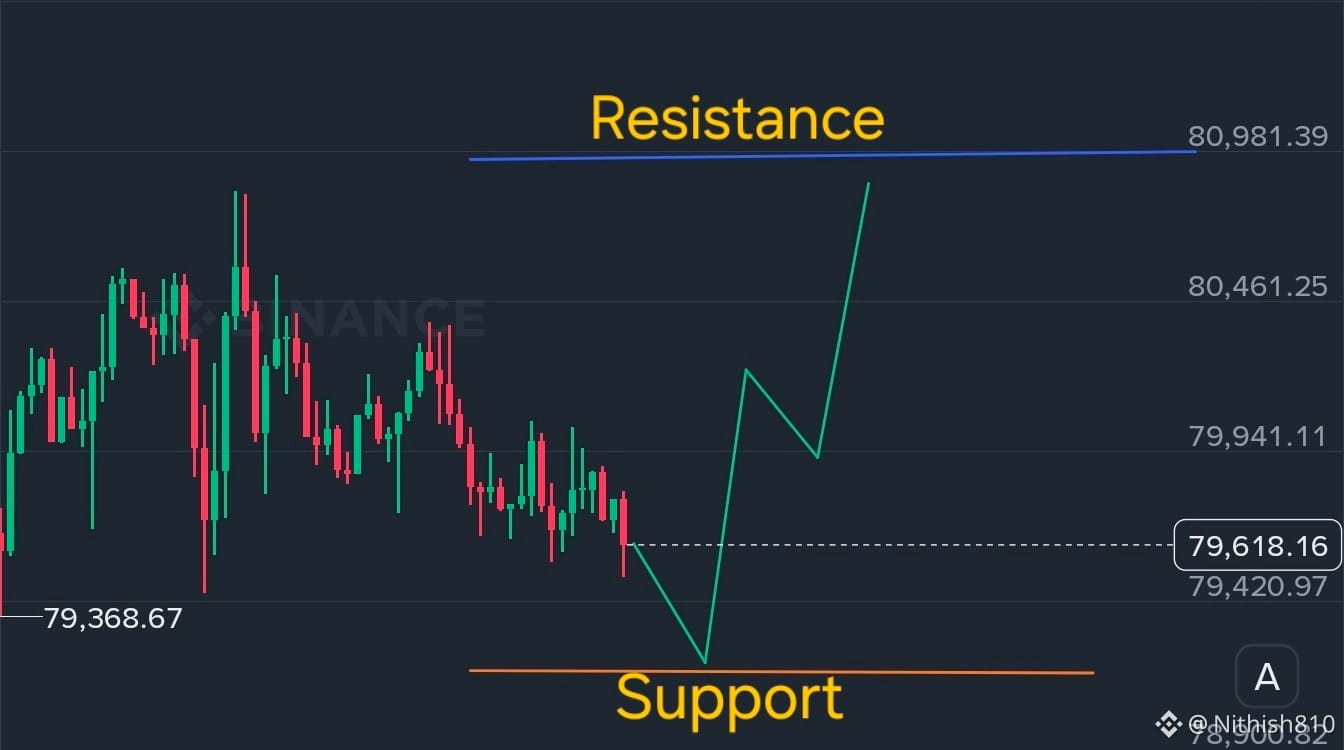
📉 YESTERDAY'S MARKET
🔴 BTC was trading around $79,500–$79,700.
🔴 Price showed lower highs and lower lows.
🔴 Sellers controlled the short-term structure.
🔴 Support near $79,220 was a key level to watch.
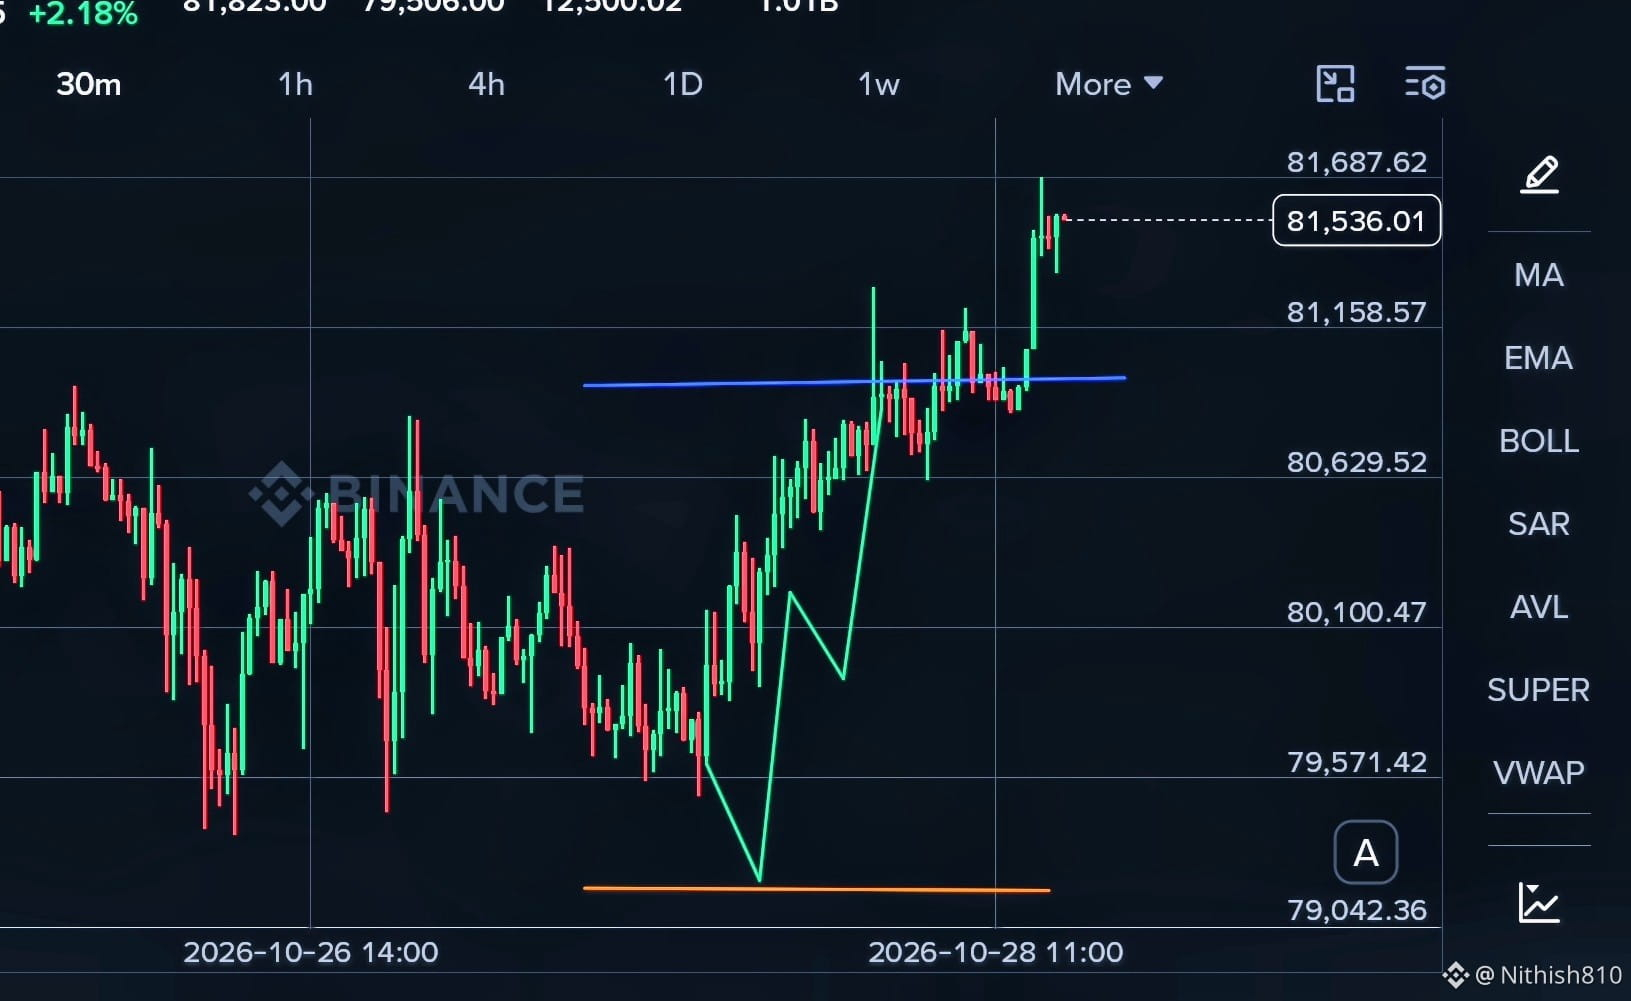
📈 TODAY'S MARKET
🟢 BTC has climbed to $81,536 (+2.18%).
🟢 Price broke above the $80,800–$81,000 resistance area.
🟢 Strong bullish candles show increased buying pressure.
🟢 BTC is now testing the $81,687–$81,823 resistance zone.
🎯 KEY LEVELS
🔹 Resistance: $81,687–$81,823
🔹 Potential support: $80,800–$81,000
🔹 Lower support: $79,220
💡 MY TAKE
Yesterday, BTC showed bearish momentum. Today, buyers have pushed price higher and broken above a key resistance zone.
If BTC holds above the breakout area, bullish continuation is possible. A rejection near $81,800 could lead to a pullback.
⚠️ Confirmation matters. A breakout is not guaranteed to continue.
👇 What's next for BTC?
🐂 $82K breakout?
🐻 Or rejection at resistance?
#bitcoin #BTCUSDT #CryptoAnalysis" #smc #PriceAction