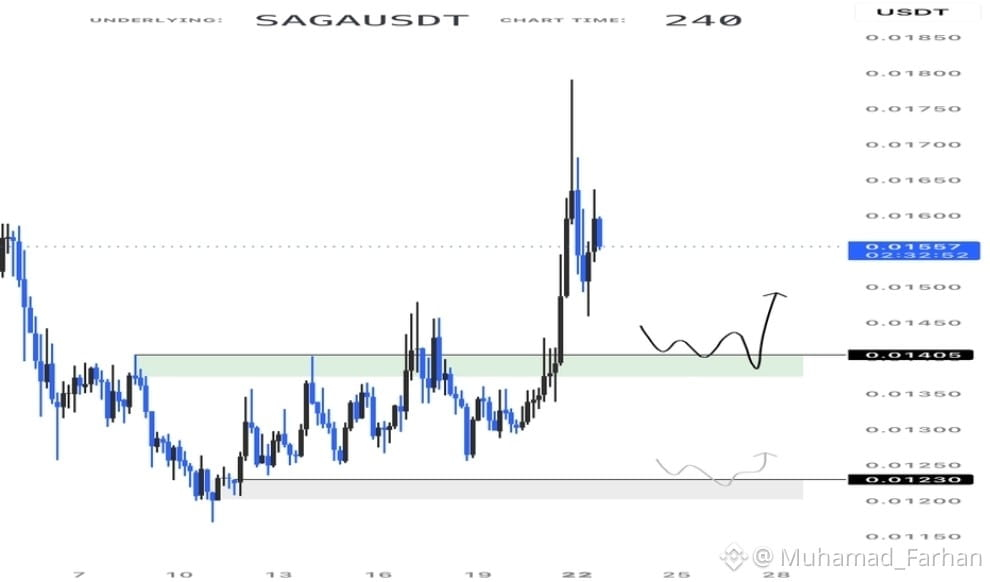
$SAGA $BTC $SOL
Saga ($SAGA ) Technical Analysis
SAGA is currently trading around the $0.0178 – $0.0182 zone, attempting to stabilize following a broader altcoin consolidation period.
1. Chart Structure & Price Action
Higher Timeframe Trend: The daily chart remains structurally biased toward the downside, sitting below key moving average bands (such as the 50-day SMA), reflecting a broader cool-off period.
Lower Timeframe (4H / Hourly): Shorter timeframes show attempts at building a bottom structure, characterized by localized higher lows and minor bullish divergences on the RSI/MACD indicators as selling pressure slows down.
2. Key Support & Resistance Levels
Immediate Support Zone: $0.0170 – $0.0172. Holding this floor is critical for preventing a retest of cycle lows near the $0.0150–$0.0160 region.
Immediate Resistance Zone: $0.0185 – $0.0192. A clean 4-hour candle close and sustained volume above this range are required to challenge higher local resistance toward $0.0220.
3. Market Outlook & Catalysts
Momentum: Volume profiles show isolated spot accumulation rather than macro-driven momentum. For a sustained structural reversal, buyers need to step in with higher volume to flip overhead moving averages.
Risk Management: Watch macro crypto liquidity trends (such as Bitcoin's anchoring around key psychological levels) as altcoins like SAGA remain sensitive to broader market sentiment shifts.#FOMCWatch #BitmineAdds10452ETH #CanMicrosoftDeliverOnAI #SouthKoreaConsidersEducationTaxOnCryptoExchanges #ThailandLaunchesWORPTStablecoinToQRPaymentApp