

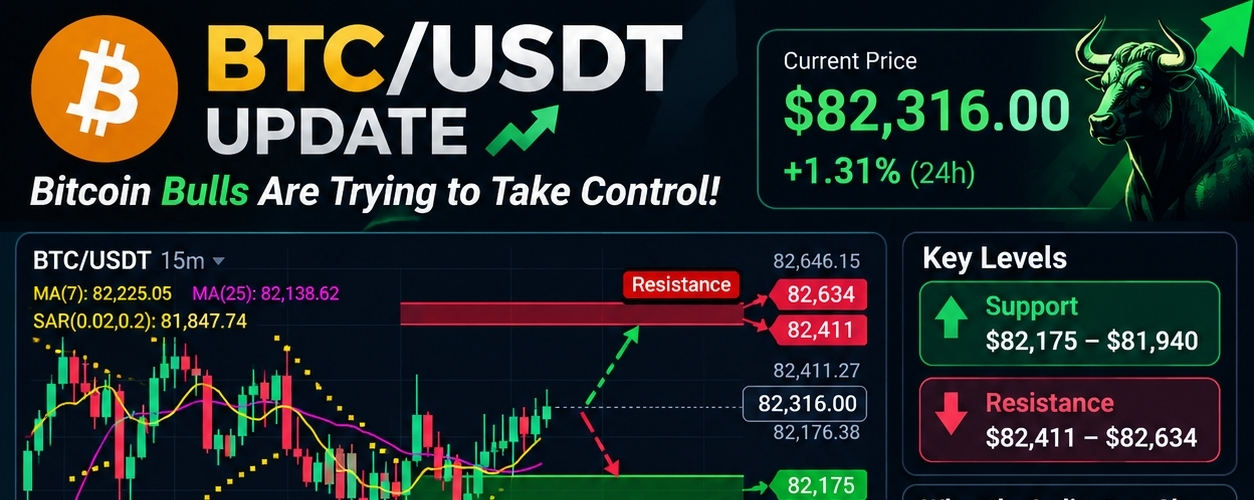

$BTC is currently trading around $82,316, showing a 1.31% gain. On the 15-minute chart, BTC is showing signs of a short-term recovery after bouncing from the $81,688 support area.
📊 Key Technical Levels
🟢 Support: $82,175 – $81,940
🔴 Resistance: $82,411 – $82,634
What the Indicators Show:
MA(7) above MA(25): Short-term momentum is improving.
MACD: Positive momentum suggests buyers are becoming more active.
Parabolic SAR: Below the current price, supporting the short-term bullish outlook.
KDJ: Momentum is strengthening, but the market could face a pullback.

🎯 What’s Next for BTC?
If Bitcoin breaks above $82,411 and holds that level, a move toward $82,634 could be possible.
However, if BTC fails to hold $82,175, sellers could push the price toward $81,940 and potentially retest $81,688.
⚠️ My Take: BTC is showing short-term bullish signals, but confirmation is important before entering a trade. Avoid chasing green candles and always manage your risk.
What do you think? Will BTC break above $82,634 or pull back first? 👇
#BTC #Bitcoin #BTCUSDT #CryptoTrading #SouthKoreaTightensOversightOfOverseasPerpetualContracts BinanceSquare #TechnicalAnalysis