


Starknet (STRK) is attracting attention after a powerful rally, with the token trading around $0.10323, up 49.78% in 24 hours, according to the latest Binance screenshots.
With approximately $71.12 million in 24-hour USDT trading volume, market activity is elevated. But after such a sharp move, can buyers push the price higher, or could profit-taking trigger a pullback?
Let's examine the 1-hour and daily charts.
📊 1H Chart: Bulls Face Immediate Resistance
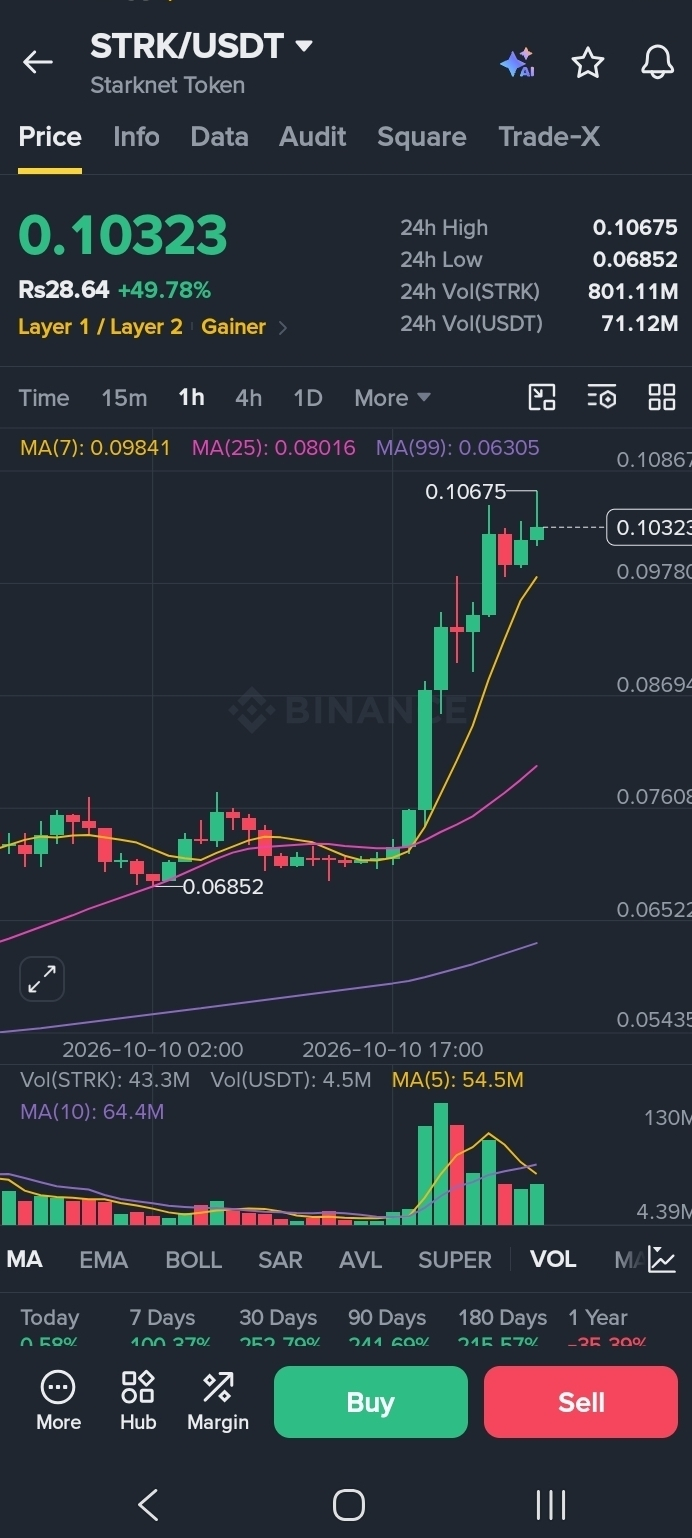
The 1-hour chart shows STRK trading above its key moving averages:
MA(7): $0.09841
MA(25): $0.08016
MA(99): $0.06305
This alignment reflects strong short-term momentum. However, the immediate challenge is the $0.10675 resistance level, which also marks the reported 24-hour high in the supplied screenshot.
A sustained candle close above $0.10675, supported by stronger volume, could strengthen the continuation scenario.
If the price fails to break this level, consolidation or a pullback may follow.
📈 1D Chart: Strong Momentum, Higher Volatility
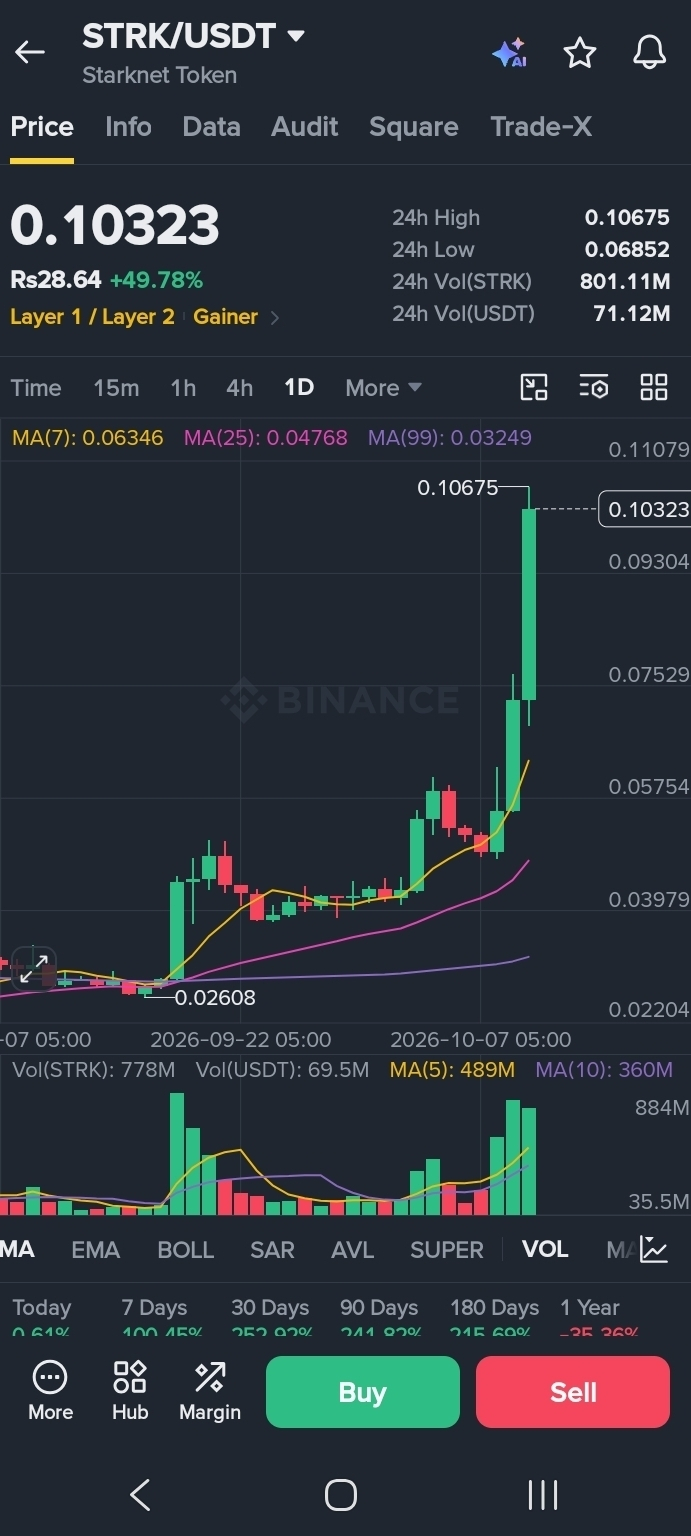
The daily chart also shows a strong upward structure:
MA(7): $0.06346
MA(25): $0.04768
MA(99): $0.03249
STRK is trading significantly above all three moving averages shown in the screenshot. This supports the strength of the recent rally, but it also means traders should be cautious about chasing an extended move.
The next resistance references are around $0.10867–$0.11079. These levels are areas to monitor, not guaranteed price targets.
🎯 Key Levels to Watch
Resistance
$0.10675: Immediate breakout test
$0.10867–$0.11079: Potential next resistance zone
Support
$0.098–$0.100: Near-term support area
$0.09304: Next support reference
$0.08694–$0.08016: Lower support zone
These levels are based on the supplied chart screenshots and may change with market conditions.
🔍 Three Possible Scenarios
Bullish scenario: A sustained move above $0.10675 with stronger volume could bring the $0.10867–$0.11079 zone into focus.
Consolidation scenario: If STRK remains below resistance while holding nearby support, the market may need time to establish its next direction.
Bearish scenario: A rejection near $0.10675 followed by a break below $0.098 could increase the risk of a deeper pullback toward $0.09304.
📝 Final Thoughts
STRK's nearly 50% daily gain highlights strong momentum, but rapid rallies can reverse just as quickly.
For now, $0.10675 is the key resistance to watch, while the $0.098–$0.100 area is an important near-term reference zone. Candle closes and trading volume may help distinguish a genuine breakout from a temporary price spike.
Rather than focusing only on the percentage gain, traders should consider volatility, confirmation and downside risk.
Disclaimer: This article is for informational and educational purposes only and is not financial advice. The analysis uses the supplied Binance chart screenshots and may become outdated as prices change. Always conduct your own research and manage risk carefully.
Hashtags
#STRK #Starknet #CryptoAnalysis #BinanceSquare #TechnicalAnalysis #CryptoMarket