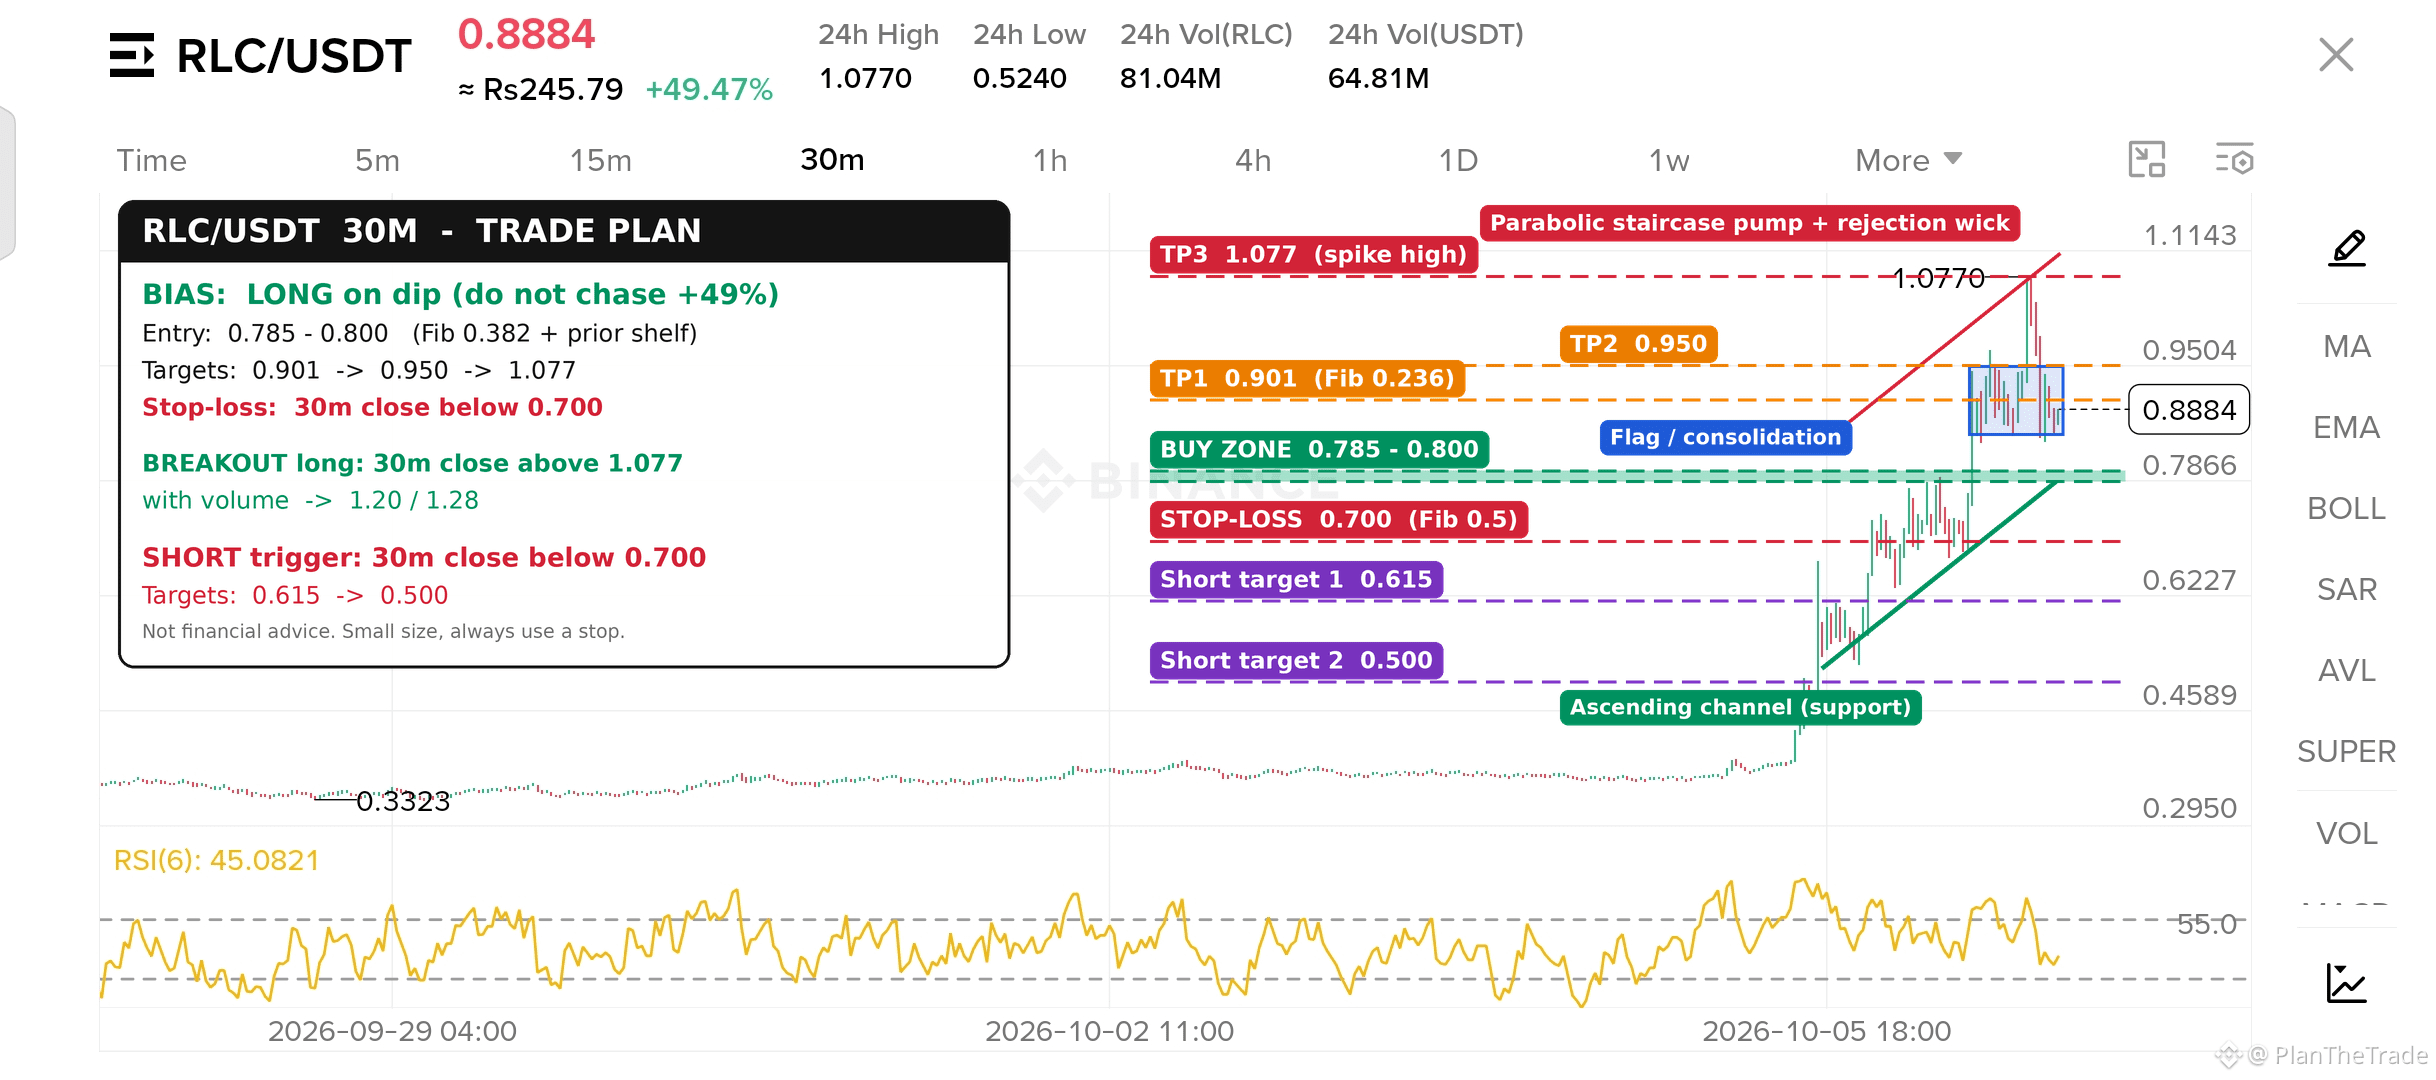
$RLC 30mins Chart Analysis
$RLC went up in steps (a staircase) from about 0.33 to a 1.077 spike, which left a rejection wick.
The green trendline is the ascending channel support. The red line is the channel top, running through the spike.
Price is now holding in a small flag between 0.85 and 0.95, near 0.888.
Call: long on a dip, not a chase (+49% already).
Entry: 0.785–0.800, which is the 0.382 Fib retracement.
Targets:
TP1: 0.901
TP2: 0.950
TP3: 1.077
Stop-loss: a 30m close below 0.700.
Breakout long: a 30m close above 1.077 with volume points to 1.20, then 1.28.
Short trigger: a 30m close below 0.700 points to 0.615, then 0.500.
Stoploss is a must, NFA, DYOR
#rlcusdt #RLC #RLC/USDT #RLCpriceprediction
$RLC went up in steps (a staircase) from about 0.33 to a 1.077 spike, which left a rejection wick.
The green trendline is the ascending channel support. The red line is the channel top, running through the spike.
Price is now holding in a small flag between 0.85 and 0.95, near 0.888.
Call: long on a dip, not a chase (+49% already).
Entry: 0.785–0.800, which is the 0.382 Fib retracement.
Targets:
TP1: 0.901
TP2: 0.950
TP3: 1.077
Stop-loss: a 30m close below 0.700.
Breakout long: a 30m close above 1.077 with volume points to 1.20, then 1.28.
Short trigger: a 30m close below 0.700 points to 0.615, then 0.500.
Stoploss is a must, NFA, DYOR
#rlcusdt #RLC #RLC/USDT #RLCpriceprediction