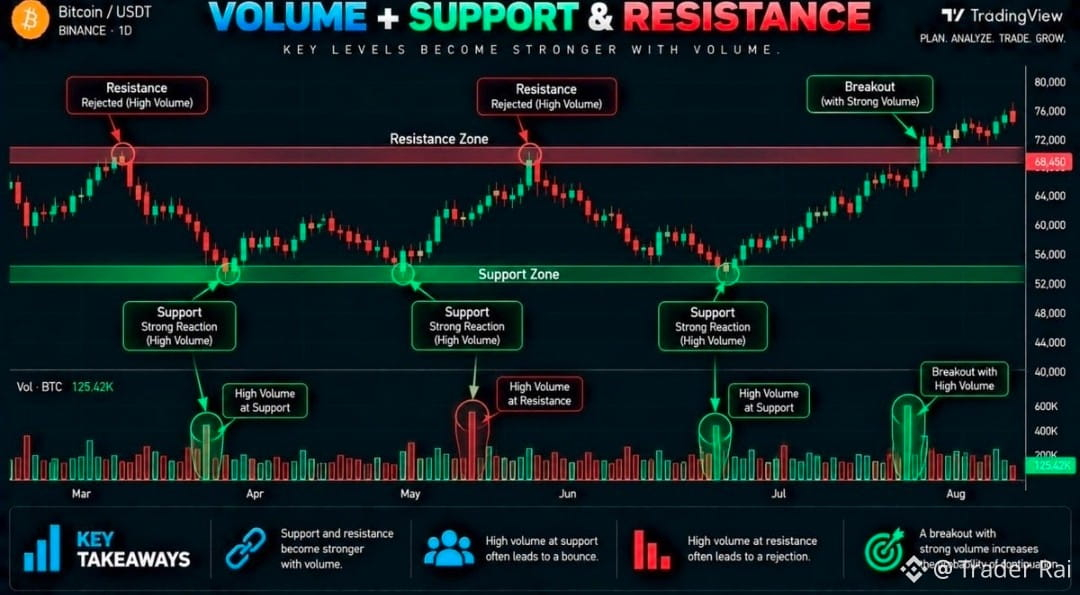


📊 Volume + Support & Resistance
Support and resistance tell you where price may react.
Volume can help you understand how much participation is behind that reaction.
That's why combining both can give your chart analysis more context.
🔹 Volume at Support price
Imagine $BTCdrops toward a major $90Ksupport zone.
Price reaches the level and suddenly:
• Volume increases
• Buyers step in
• Price strongly rejects the lows
This can suggest that there is strong participation around support and buyers are actively defending the area.
But remember — high volume doesn't automatically mean a bounce.
You still need price confirmation.
🔸 Volume at Resistance
Now imagine $BTC reaches $100Kresistance.
gets rejected while volume suddenly increases, it can indicate strong activity around the resistance zone.
Sellers may be defending the level, but buyers could also be aggressively trying to break through it.
So watch what price does next.
🚀 Breakout + Volume
$BTC breaks above $100Kwith a strong candle and increasing volume.
That can make the breakout more convincing because participation is supporting the move.
Similarly:
• Support breaks
• Volume increases
• Breakdown can become more significant.
⚠️ Read Volume With Price Action
This is the key lesson.
Don't think:
❌ High volume at support = guaranteed bounce
❌ High volume at resistance = guaranteed rejection
Instead, ask:
👉 Where is the volume appearing?
👉 How did price react?
👉 Did the candle close beyond the level?
👉 Did the breakout hold?
👉 What does market structure show?
Remember:
•Support & resistance give you the location.
•Volume shows participation.
•Price action confirms the reaction.