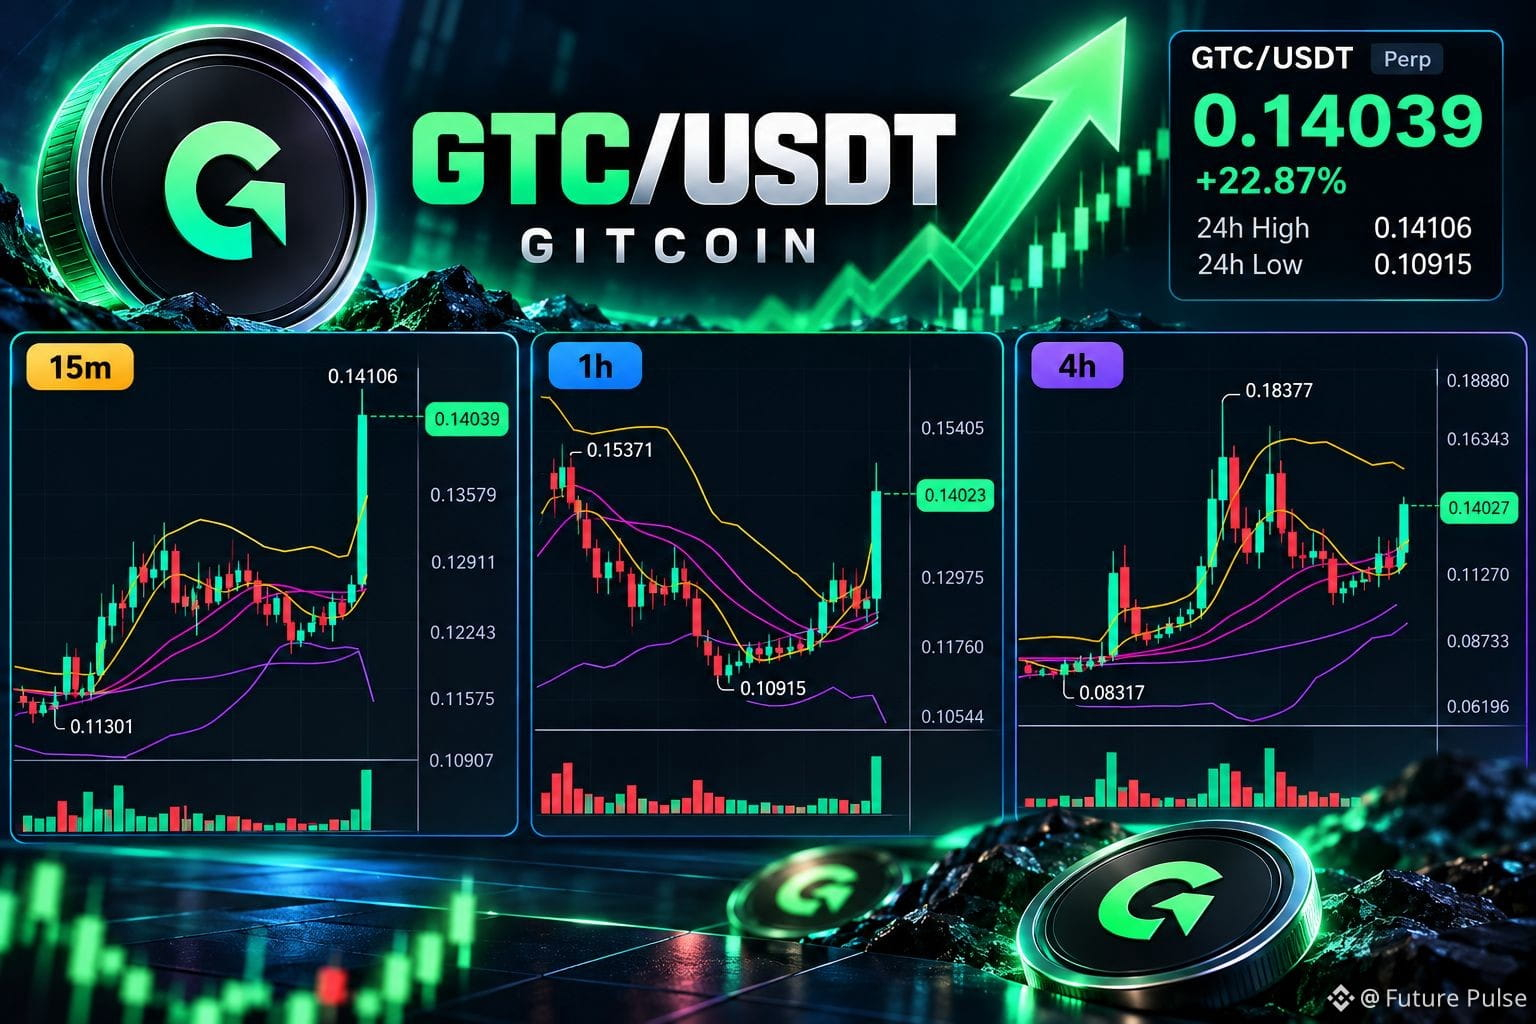

GTC is showing bullish momentum after breaking above its consolidation. On the 15m chart, price surged to $0.14106 with a volume spike, while the 1H chart confirms a breakout above the $0.129–$0.132 area.
The 1H MACD has turned positive, and price is above the 7/25/99 MAs, supporting the bullish structure. On 4H, $0.151–$0.152 is the next key resistance near the upper Bollinger Band.
A hold above $0.135 could keep buyers in control. If momentum fades, $0.129–$0.132 is the first support, followed by $0.120.
Volatility is elevated, so confirmation matters more than chasing the spike.
$TMX
$PONS
$GTC
The 1H MACD has turned positive, and price is above the 7/25/99 MAs, supporting the bullish structure. On 4H, $0.151–$0.152 is the next key resistance near the upper Bollinger Band.
A hold above $0.135 could keep buyers in control. If momentum fades, $0.129–$0.132 is the first support, followed by $0.120.
Volatility is elevated, so confirmation matters more than chasing the spike.
$TMX
$PONS
$GTC