AXS: Rejection Near Broadening Wedge Resistance Ceiling – Strategic Trend-Continuation Short Targeting $0.50 Floor
Axie Infinity (AXS) is presenting a high-conviction trend-continuation Short setup on the daily timeframe as its corrective relief wave collides directly with a major macro resistance barrier. Following the severe macro markdown originating from the $3.20 peak early this year, broader market structure remains strictly governed by prevailing sellers inside an expansive broadening formation.
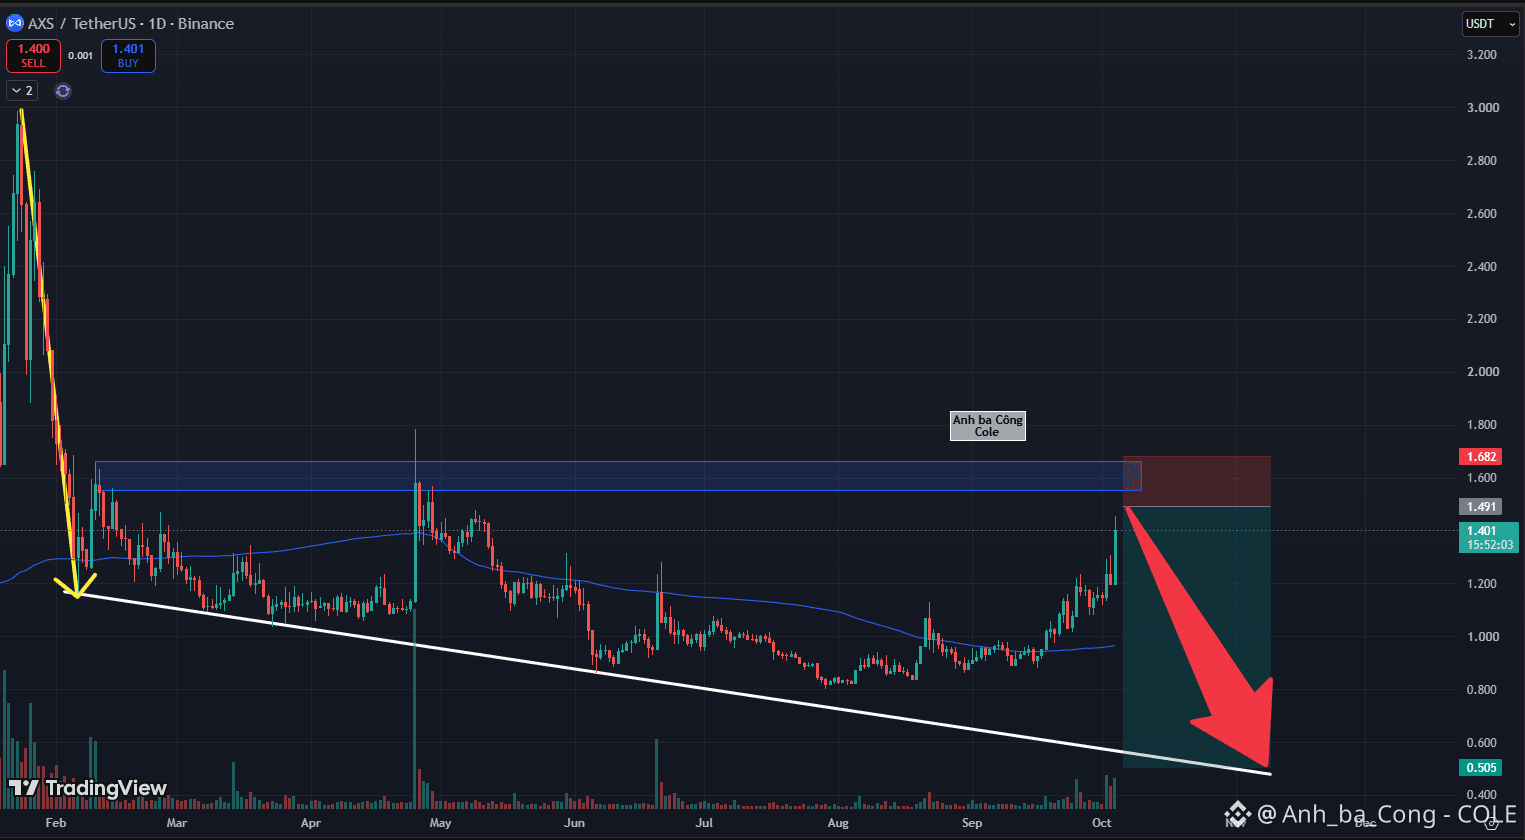
Based on visual data from the daily chart , active price candles near the $1.401 handle pushed into the lower boundary of the highlighted resistance zone spanning $1.49–$1.68 before stalling visibly. This overhead block has triggered repeated heavy distribution waves throughout prior months, confirming that trapped residual supply remains dense. While price action temporarily trades above the dynamic MA100 baseline, upward momentum is visibly exhausting as buying turnover contracts. Stalling beneath this structural barrier indicates that dominant market participants are merely using corrective liquidity to unload inventory rather than driving a genuine breakout. As sell-side pressure reasserts control, price action is primed for an aggressive downward rotation.
The optimal trading approach is to initiate Short positions within the $1.40–$1.49 zone. A protective stop-loss parameter should be placed safely above the structural ceiling at $1.682. The primary strategic take-profit objective targets the lower diagonal support baseline near $0.505, capturing superior risk-to-reward metrics.
Disclaimer: This is not financial advice, DYOR. $AXS $IO $QI
Axie Infinity (AXS) is presenting a high-conviction trend-continuation Short setup on the daily timeframe as its corrective relief wave collides directly with a major macro resistance barrier. Following the severe macro markdown originating from the $3.20 peak early this year, broader market structure remains strictly governed by prevailing sellers inside an expansive broadening formation.
Based on visual data from the daily chart , active price candles near the $1.401 handle pushed into the lower boundary of the highlighted resistance zone spanning $1.49–$1.68 before stalling visibly. This overhead block has triggered repeated heavy distribution waves throughout prior months, confirming that trapped residual supply remains dense. While price action temporarily trades above the dynamic MA100 baseline, upward momentum is visibly exhausting as buying turnover contracts. Stalling beneath this structural barrier indicates that dominant market participants are merely using corrective liquidity to unload inventory rather than driving a genuine breakout. As sell-side pressure reasserts control, price action is primed for an aggressive downward rotation.
The optimal trading approach is to initiate Short positions within the $1.40–$1.49 zone. A protective stop-loss parameter should be placed safely above the structural ceiling at $1.682. The primary strategic take-profit objective targets the lower diagonal support baseline near $0.505, capturing superior risk-to-reward metrics.
Disclaimer: This is not financial advice, DYOR. $AXS $IO $QI