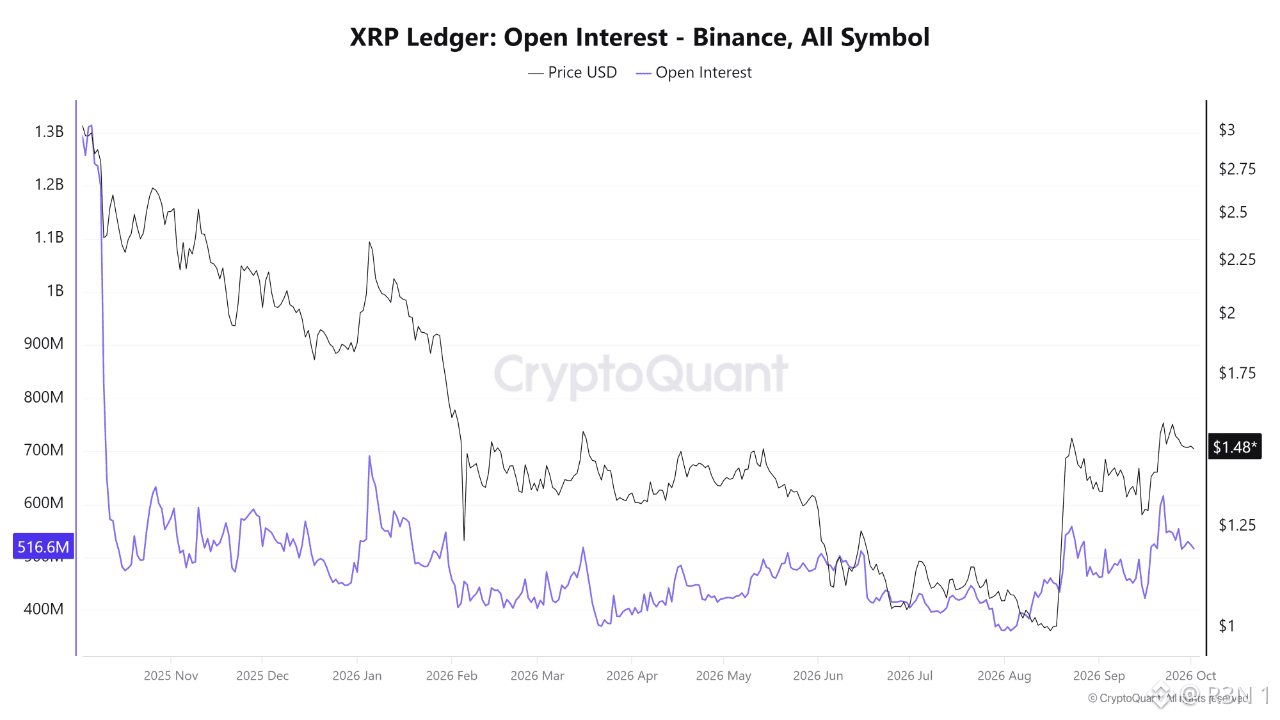
XRP open interest on Binance sits at 516.6M right now, up off its 2026 low near 350 to 400M, but still nowhere close to where it started this chart, above 1.3B back in October 2025. Price has done a lot better by comparison, recovering to $1.48 from a February low near $1. What stands out to me looking at the full chart is how closely these two lines have actually tracked each other. The initial collapse was brutal and immediate, open interest cratering from 1.3B down to the 500 to 600M range within weeks, right alongside price sliding from near $3 toward $2.20. Both kept falling together through a volatile February too, open interest hitting its cycle low near 350 to 400M as price dropped sharply toward $1.50. Then March through July, both basically chopped sideways, no real trend in either direction. Personally, the part I find most interesting is late August into September, where both lines actually spiked together, open interest jumping from around 400M past 700M, price climbing from near $1 to $1.25 to $1.30, before both pulled back to where they sit now. My honest read: that gap between price's recovery and open interest's recovery is the real story here. Price at $1.48 is a genuine rebound, but open interest at 516.6M is still well below both its October starting point and its own September peak. I think that asymmetry points to a market that's less leveraged and more cautious right now than it was a year ago, not necessarily a bad thing, just a different character of market. Where I'd push back on reading too much into either line alone, these two have moved together this entire chart, so the current gap is worth watching, not dismissing as noise. What I'm watching: whether open interest keeps climbing back toward that recent peak, or whether this pullback in both series extends further from here. $XRP #BTC Price Analysis# #Altcoin Season#