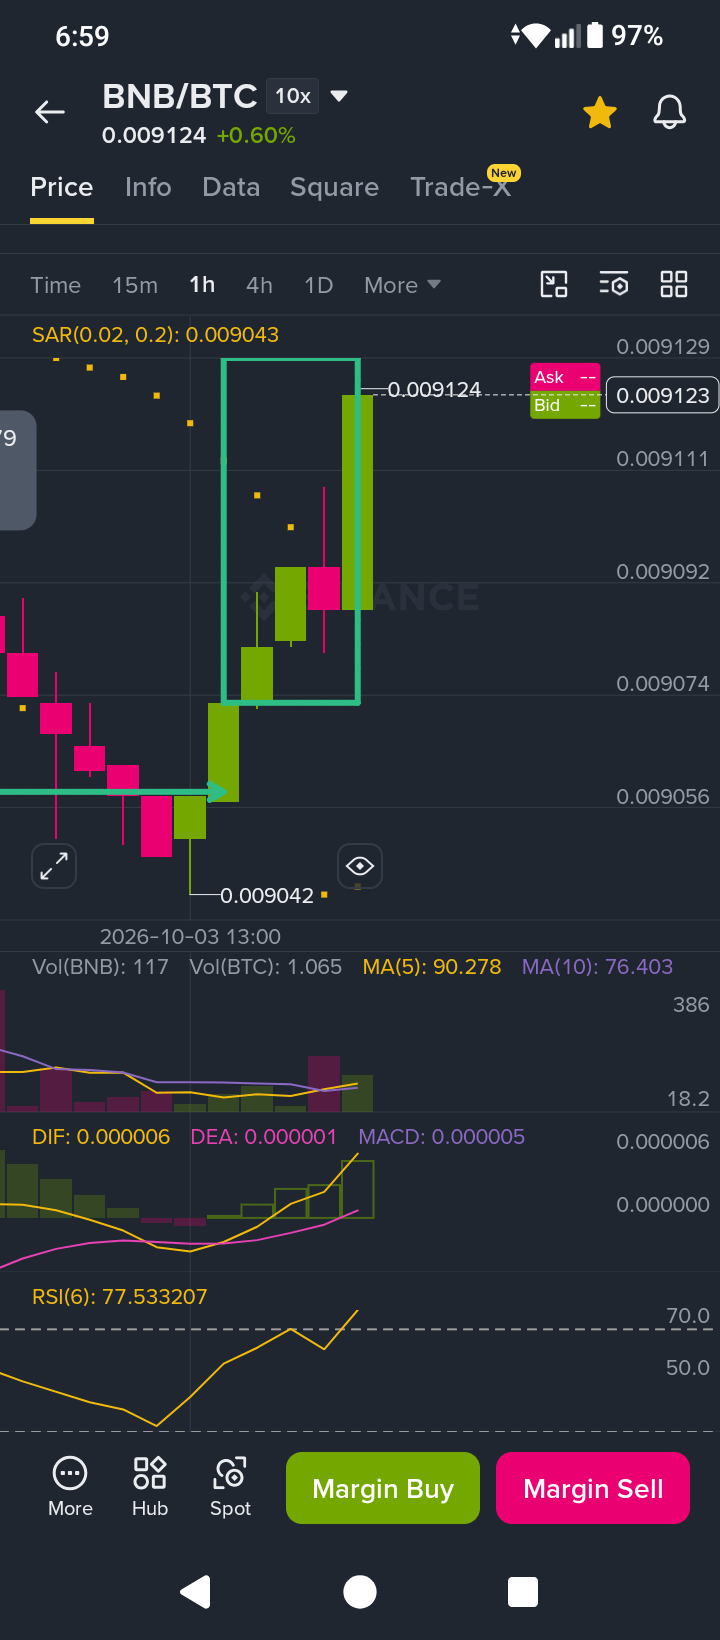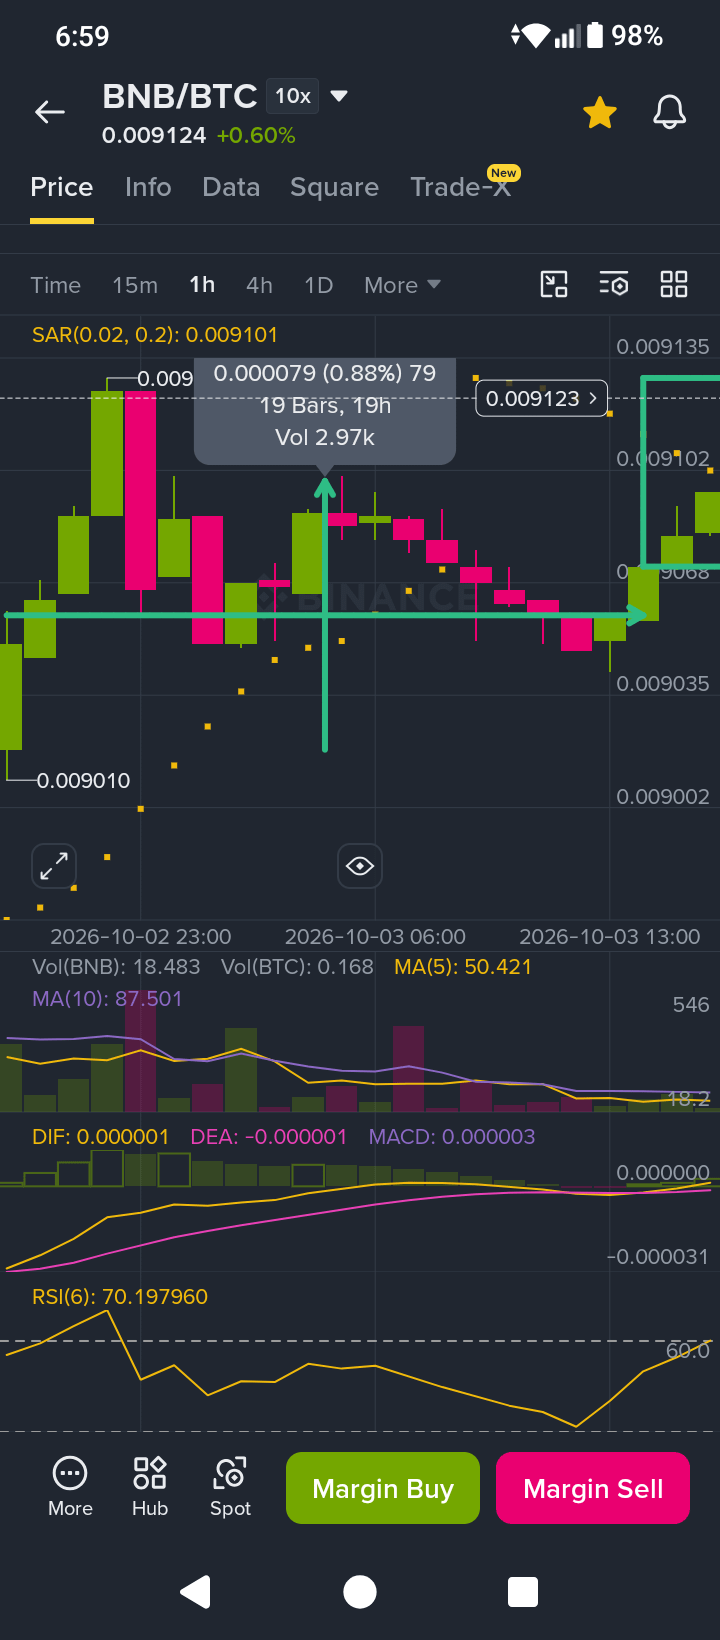

BNB/BTC has shown a strong bullish move on the 1h timeframe.
*Chart Analysis:*
1. *Strong Support Bounce:* Price found strong support around 0.009042 - 0.009056 zone. The long wick and strong green candle from this area shows buyers are active.
2. *Breakout Structure:* The pair broke above 0.009092 and is now trying to hold above 0.009123. This level was previous resistance, now acting as breakout zone.
3. *Indicators:*
- SAR dots are now below price, indicating bullish trend.
- MACD histogram is turning green and DIF is crossing above DEA, showing bullish momentum building.
- RSI(6) is at 77.5 on 1h and 70.19 on higher view. This indicates strong momentum but also overbought condition, so short-term pullback is possible.
4. *Volume:* Vol(BNB) increased to 117 on breakout candle, which confirms interest behind the move.
*What to Watch:*
If BNB/BTC holds above 0.009056 - 0.009068 support zone, the bullish structure remains valid. If price fails to hold above 0.009123, it may retest the support zone.
This is my personal chart observation and not financial advice. Always manage your risk.
What do you think? Will BNB continue to outperform BTC?
If this analysis helped you, you can support me with a small Tip.
#BNB #BTC #BNBBTC #CryptoAnalysis #TechnicalAnalysis #Breakout #BinanceSquare #BNBPro $AAPL.US #BitcoinRejectedAt$87K #BitcoinParesGainsAfterRallyTo$86.5K