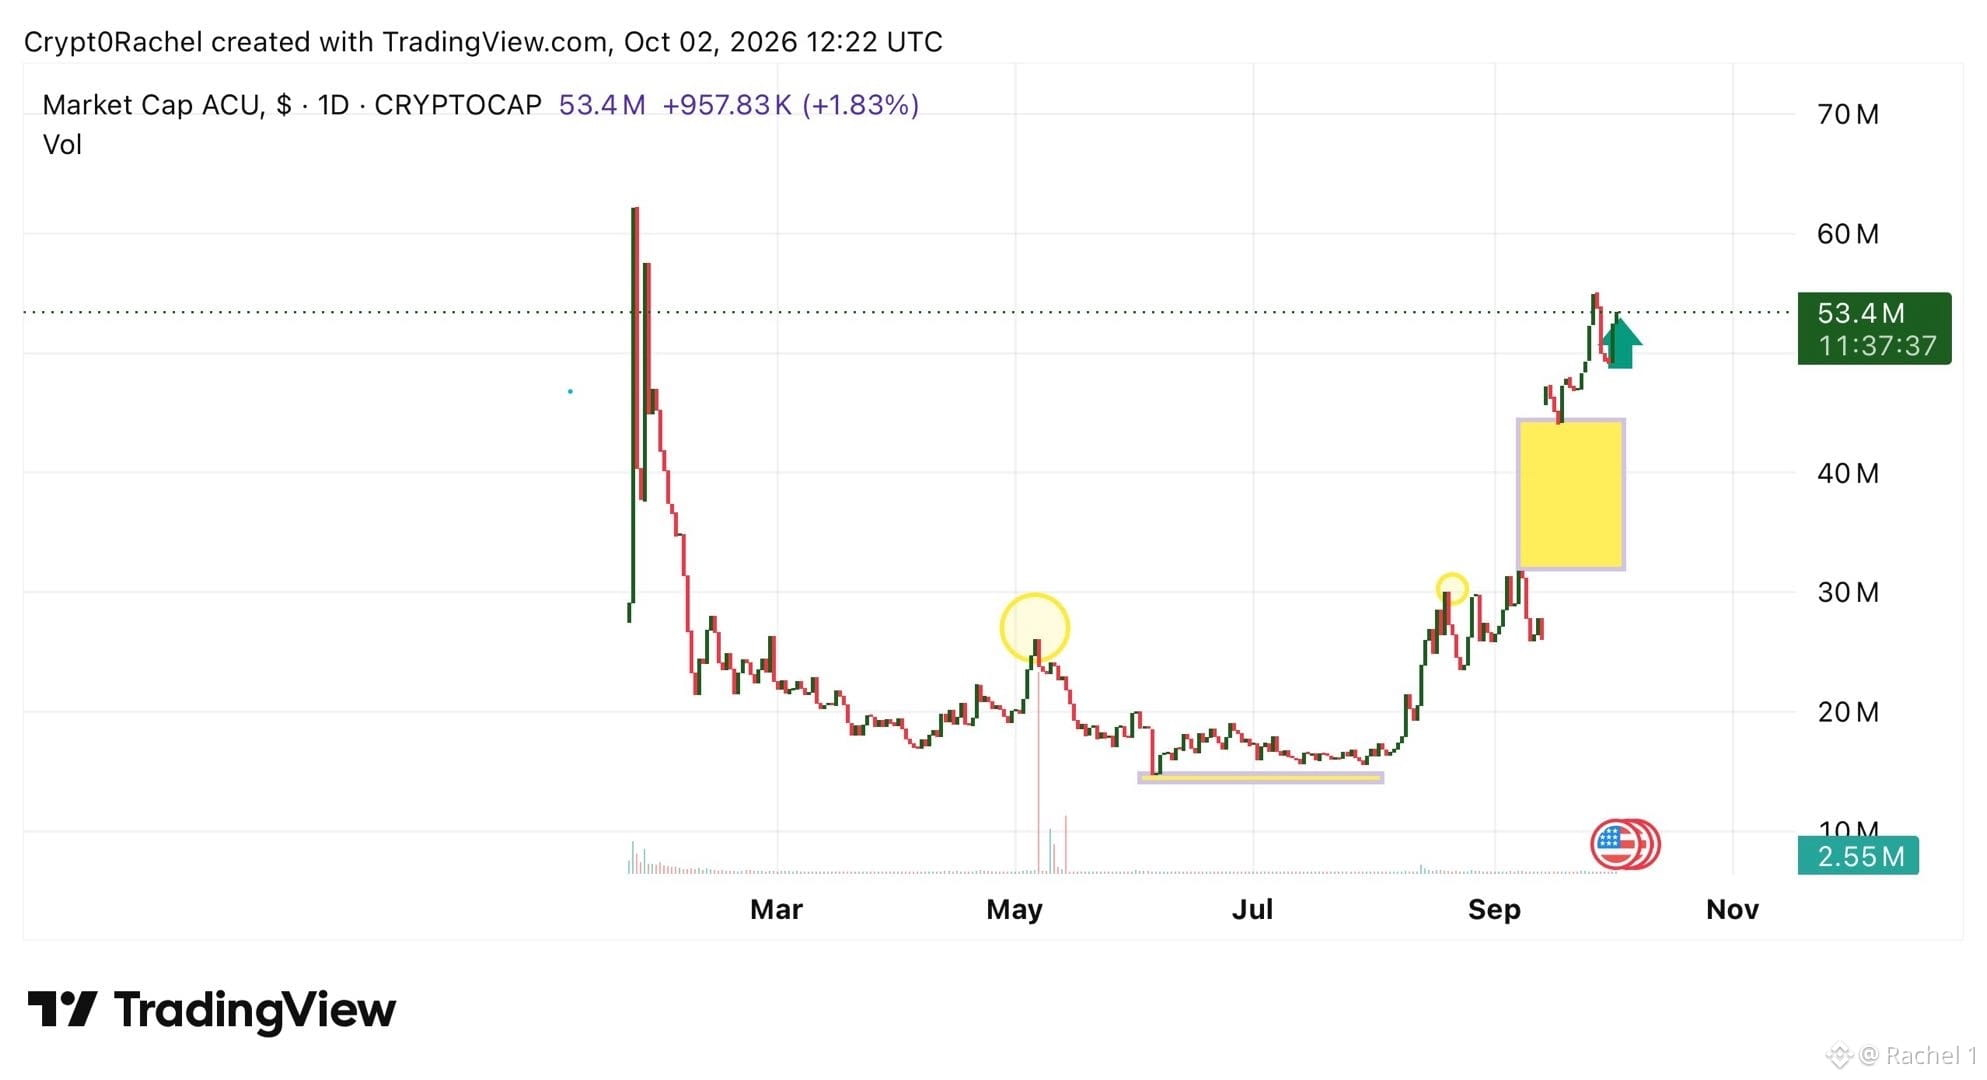
$ACU 53M market cap. That’s a very different chart from where #ACU was sitting a few months ago.
The interesting part for me isn’t just the latest move. It’s the amount of time this thing spent building a base before finally starting to expand.
We’ve now pushed through the 30M area and the 40M+ zone, with the market cap reaching around 53.4M.
At this point, I’m more interested in what happens after the breakout than chasing the move itself.
If the 40–45M region holds during a pullback, that would make the chart a lot more interesting.
If it loses that area, then we may simply need more consolidation.
Either way, #ACU has definitely changed its structure.
Worth keeping on the radar.
Invite code: px7akk
The interesting part for me isn’t just the latest move. It’s the amount of time this thing spent building a base before finally starting to expand.
We’ve now pushed through the 30M area and the 40M+ zone, with the market cap reaching around 53.4M.
At this point, I’m more interested in what happens after the breakout than chasing the move itself.
If the 40–45M region holds during a pullback, that would make the chart a lot more interesting.
If it loses that area, then we may simply need more consolidation.
Either way, #ACU has definitely changed its structure.
Worth keeping on the radar.
Invite code: px7akk