$ALICE /USDT
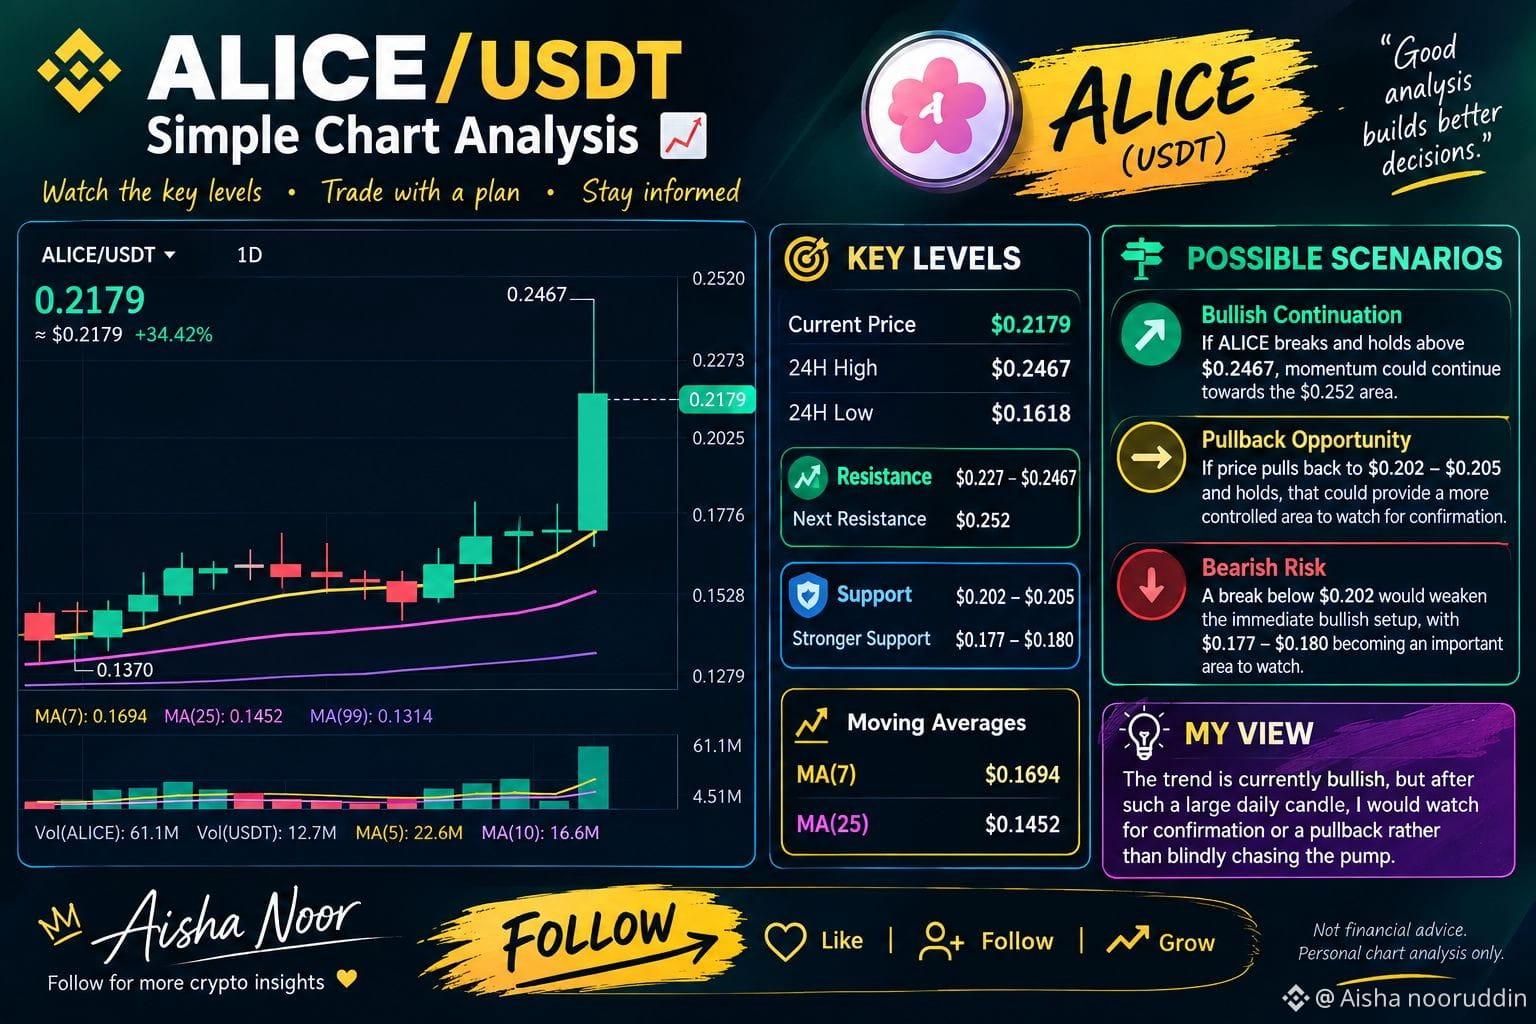
$ALICE is showing strong bullish momentum on the 1D chart, but the price has already made a sharp move, so chasing the current candle carries higher risk.
Current price: ~$0.2179
24H high: $0.2467
24H low: $0.1618
Resistance: $0.227–$0.2467
Next resistance: around $0.252
Support: $0.202–$0.205
Stronger support: $0.177–$0.180
MA(7): $0.1694
MA(25): $0.1452
Possible scenarios: 🟢 If $ALICE breaks and holds above $0.2467, bullish momentum could continue toward the $0.252 area.
🟡 If price pulls back toward $0.202–$0.205 and holds, that could provide a more controlled area to watch for confirmation.
🔴 A break below $0.202 would weaken the immediate bullish setup, with $0.177–$0.180 becoming an important area to watch.
My view: The trend is currently bullish, but after such a large daily candle, I would watch for confirmation or a pullback rather than blindly chasing the pump.
Personal chart analysis only.
$ALICE is showing strong bullish momentum on the 1D chart, but the price has already made a sharp move, so chasing the current candle carries higher risk.
Current price: ~$0.2179
24H high: $0.2467
24H low: $0.1618
Resistance: $0.227–$0.2467
Next resistance: around $0.252
Support: $0.202–$0.205
Stronger support: $0.177–$0.180
MA(7): $0.1694
MA(25): $0.1452
Possible scenarios: 🟢 If $ALICE breaks and holds above $0.2467, bullish momentum could continue toward the $0.252 area.
🟡 If price pulls back toward $0.202–$0.205 and holds, that could provide a more controlled area to watch for confirmation.
🔴 A break below $0.202 would weaken the immediate bullish setup, with $0.177–$0.180 becoming an important area to watch.
My view: The trend is currently bullish, but after such a large daily candle, I would watch for confirmation or a pullback rather than blindly chasing the pump.
Personal chart analysis only.