$HBAR
/USDT (Hedera Hashgraph against Tether) on Binance:
Current Price & Performance
· Price: 0.11259 USDT
· 24h Change: +18.52%
· 24h High: 0.11555 USDT
· 24h Low: 0.09292 USDT
· 24h Volume (HBAR): 688.93M
· 24h Volume (USDT): 72.67M
Market Tags
· Layer 1 / Layer 2
· Gainer
Technical Chart Analysis (15m Timeframe)
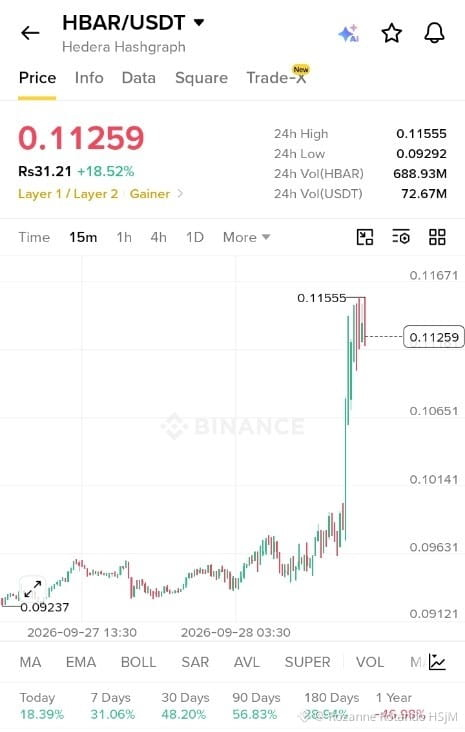
· The chart shows a massive, sudden upward spike (a "green candle") from around 0.09631 to a peak of 0.11555, followed by a slight pullback to the current price of 0.11259.
· The price is currently trading well above the moving averages (indicated by the lines on the chart).
· The RSI (Relative Strength Index) is shown at Rs31.21, which indicates the asset is currently in oversold territory on this short-term timeframe, despite the recent massive price surge.
Historical Performance (Bottom Bar)
· Today: +18.39%
· 7 Days: +31.06%
· 30 Days: +48.20%
· 90 Days: +56.83%
· 180 Days: +28.94%
· 1 Year: -46.98%
Overall Observation
The image captures a highly volatile moment for HBAR. While it has seen a massive 18%+ surge in the last 24 hours (and is up significantly over the last 3 months), it is still down nearly 47% compared to its price one year ago. The short-term RSI suggests a potential cooling off or correction after the sharp spike.
/USDT (Hedera Hashgraph against Tether) on Binance:
Current Price & Performance
· Price: 0.11259 USDT
· 24h Change: +18.52%
· 24h High: 0.11555 USDT
· 24h Low: 0.09292 USDT
· 24h Volume (HBAR): 688.93M
· 24h Volume (USDT): 72.67M
Market Tags
· Layer 1 / Layer 2
· Gainer
Technical Chart Analysis (15m Timeframe)
· The chart shows a massive, sudden upward spike (a "green candle") from around 0.09631 to a peak of 0.11555, followed by a slight pullback to the current price of 0.11259.
· The price is currently trading well above the moving averages (indicated by the lines on the chart).
· The RSI (Relative Strength Index) is shown at Rs31.21, which indicates the asset is currently in oversold territory on this short-term timeframe, despite the recent massive price surge.
Historical Performance (Bottom Bar)
· Today: +18.39%
· 7 Days: +31.06%
· 30 Days: +48.20%
· 90 Days: +56.83%
· 180 Days: +28.94%
· 1 Year: -46.98%
Overall Observation
The image captures a highly volatile moment for HBAR. While it has seen a massive 18%+ surge in the last 24 hours (and is up significantly over the last 3 months), it is still down nearly 47% compared to its price one year ago. The short-term RSI suggests a potential cooling off or correction after the sharp spike.