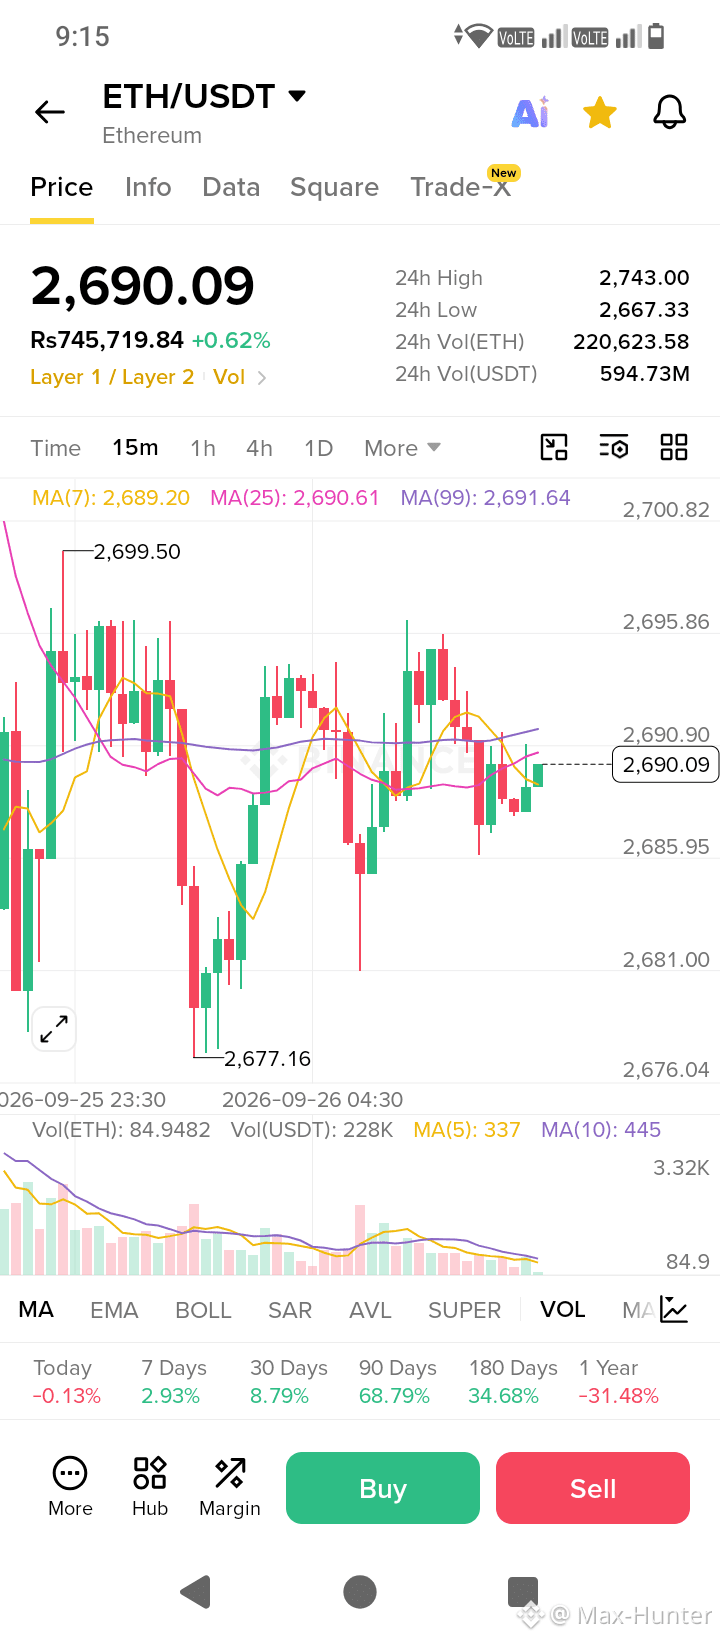
$BASED on the ETH/USDT 15-minute chart provided:
Current Overview
* Current Price: 2,690.09 USDT
* 24h High: 2,743.00 USDT
* 24h Low: 2,667.33 USDT
* Recent Local Range: High of 2,699.50 to a low of 2,677.16.
Technical Analysis Key Points
* Moving Averages Convergence:
* MA(7) (Yellow): 2,689.20
* MA(25) (Pink): 2,690.61
* MA(99) (Purple): 2,691.64
* Observation: All three short/medium-term moving averages are clustered tightly together between 2,689 and 2,691. This indicates a consolidation phase with minimal momentum in either direction right now.
* Price Action & Candlesticks:
* The price recently bounced off a lower swing low around 2,677.16 and formed a series of small green candles recovering back up to the MA levels.
* Right now, price is testing immediate resistance right around the 2,690 – 2,692 zone (where MA(25) and MA(99) sit).
* Volume Analysis:
* Trading volume on the lower indicator panel is low and flattening out compared to the earlier sell-off wave down to 2,677. Low volume during consolidation usually precedes a volatility expansion (breakout or breakdown).
Scenarios to Watch
* Bullish Scenario (Breakout):
* Needs a clean 15m candle close above 2,692.00 with increasing buying volume.
* Primary target would be testing the recent swing high at 2,699.50 – 2,700.00.
* Bearish Scenario (Rejection):
* Rejection at the MA cluster (2,691.00) could send price back down to retest support at 2,681.00 and potentially 2,677.00.
Disclaimer: Crypto markets carry high risk. Technical analysis provides insights into probability, not certainty. Always use proper risk management (stop-losses).
Current Overview
* Current Price: 2,690.09 USDT
* 24h High: 2,743.00 USDT
* 24h Low: 2,667.33 USDT
* Recent Local Range: High of 2,699.50 to a low of 2,677.16.
Technical Analysis Key Points
* Moving Averages Convergence:
* MA(7) (Yellow): 2,689.20
* MA(25) (Pink): 2,690.61
* MA(99) (Purple): 2,691.64
* Observation: All three short/medium-term moving averages are clustered tightly together between 2,689 and 2,691. This indicates a consolidation phase with minimal momentum in either direction right now.
* Price Action & Candlesticks:
* The price recently bounced off a lower swing low around 2,677.16 and formed a series of small green candles recovering back up to the MA levels.
* Right now, price is testing immediate resistance right around the 2,690 – 2,692 zone (where MA(25) and MA(99) sit).
* Volume Analysis:
* Trading volume on the lower indicator panel is low and flattening out compared to the earlier sell-off wave down to 2,677. Low volume during consolidation usually precedes a volatility expansion (breakout or breakdown).
Scenarios to Watch
* Bullish Scenario (Breakout):
* Needs a clean 15m candle close above 2,692.00 with increasing buying volume.
* Primary target would be testing the recent swing high at 2,699.50 – 2,700.00.
* Bearish Scenario (Rejection):
* Rejection at the MA cluster (2,691.00) could send price back down to retest support at 2,681.00 and potentially 2,677.00.
Disclaimer: Crypto markets carry high risk. Technical analysis provides insights into probability, not certainty. Always use proper risk management (stop-losses).