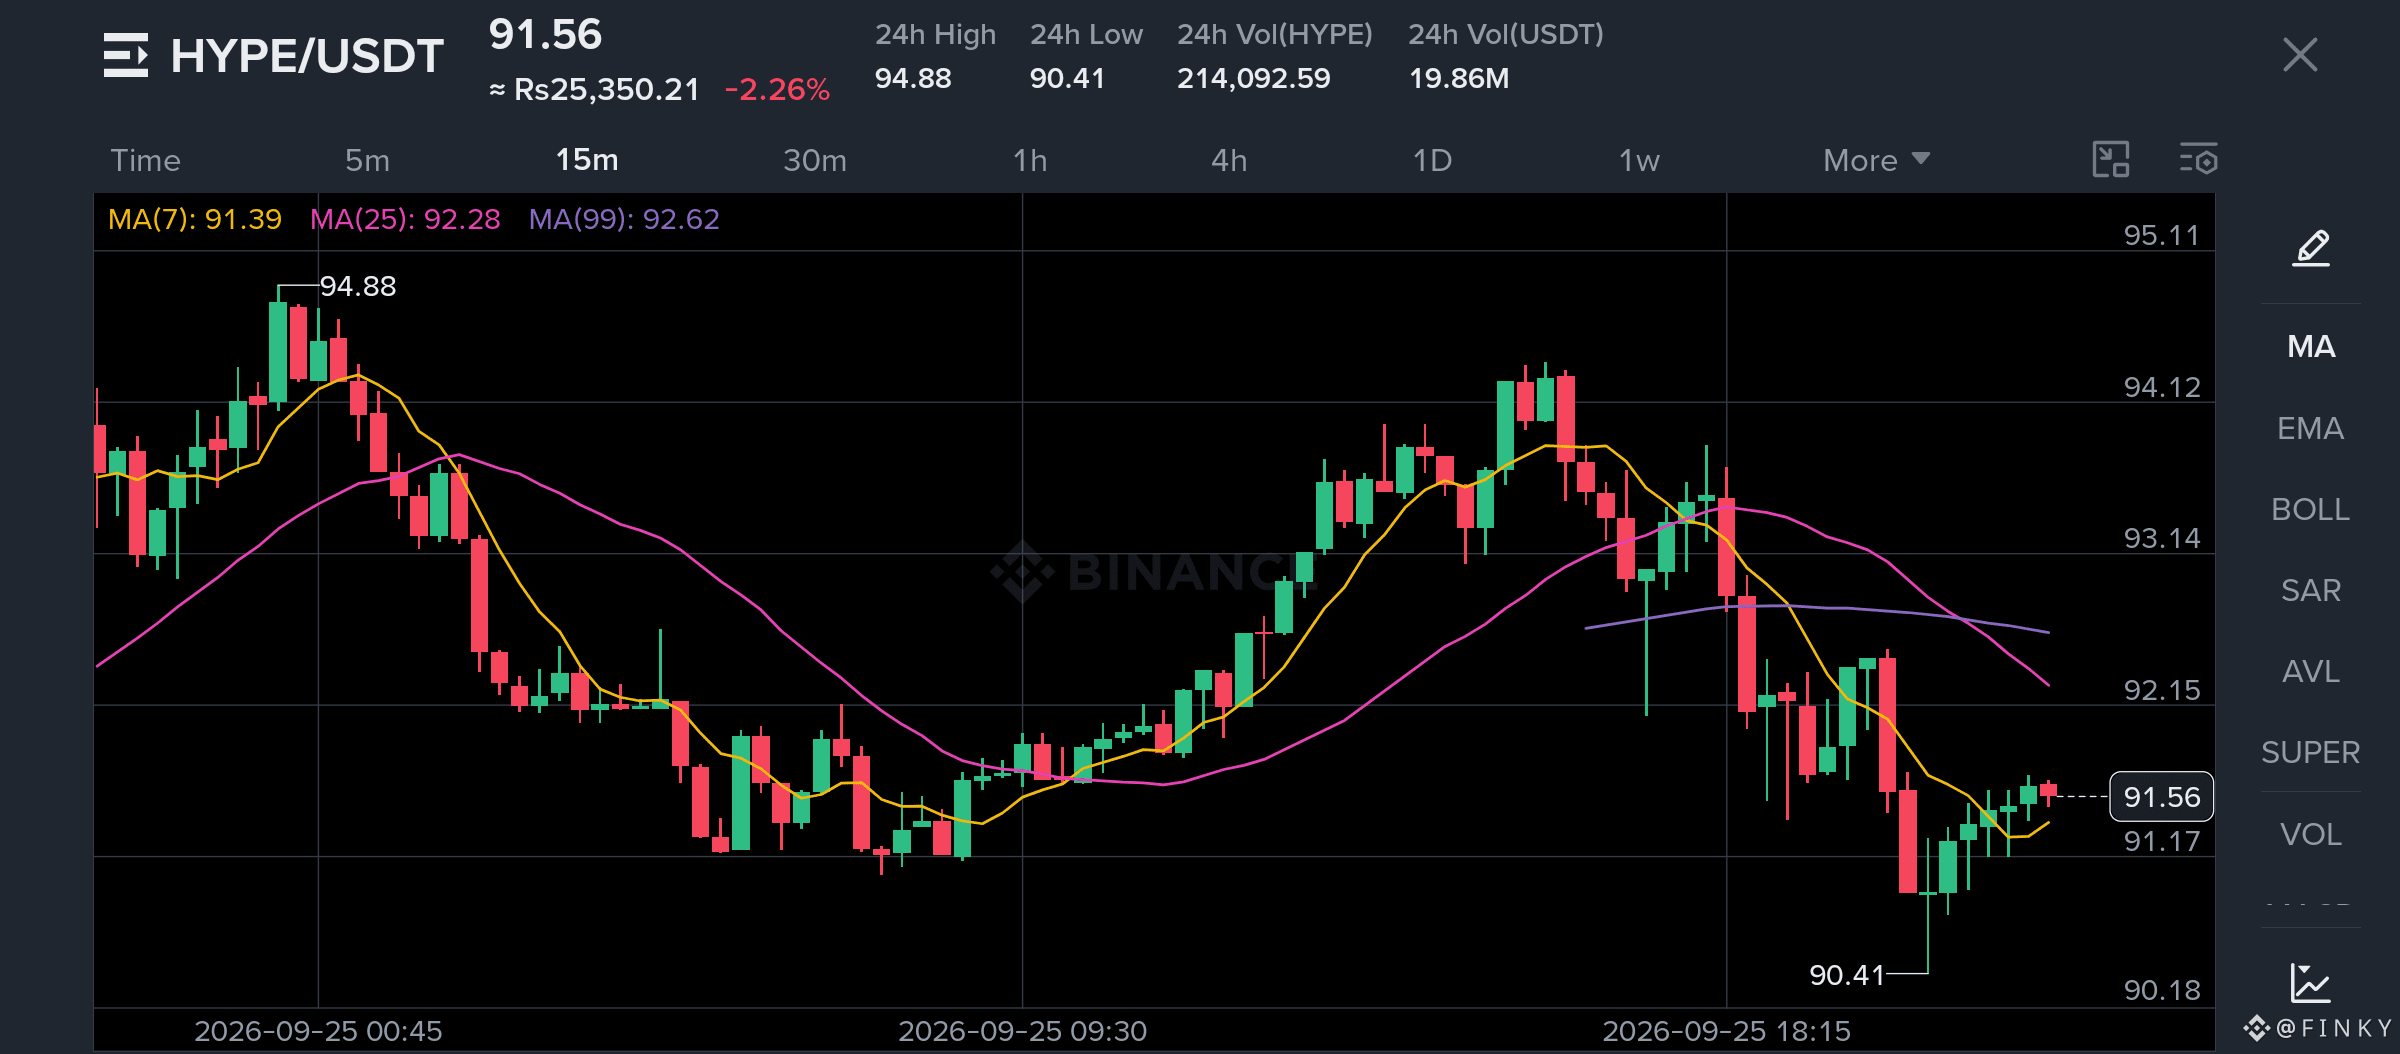

$HYPE — HYPE is sitting at a key level after a sharp rejection from 94.88.
Price is now around 91.56, down 2.26% over the last 24 hours. The 15M chart shows a clear shift in momentum: after recovering toward 94.12, price was rejected and dropped hard to the 90.41 low.
Now the interesting part is the reaction from 90.41.
MA(7): 91.39
MA(25): 92.28
MA(99): 92.62
Price has recovered back above the MA(7), but it is still below the MA(25) and MA(99). That makes the 92.15–92.62 area an important resistance zone to watch.
24H High: 94.88
24H Low: 90.41
24H Volume: 214,092 HYPE
24H USDT Volume: 19.86M
Entry Zone: 91.20 – 91.60
Stop Loss: 90.18
TP1: 92.15
TP2: 92.62
TP3: 93.14
TP4: 94.12
The key support is around 90.40–90.20. If buyers continue defending that area, a recovery toward the moving-average resistance could develop.
But there is no need to chase the move. The real confirmation comes from how HYPE behaves around 92.15 and then 92.62.
A clean reclaim with stronger volume would put 93.14 and 94.12 back on the radar.
HYPE has already shown how quickly this chart can move. Now the 90.40 support and 92.15–92.62 resistance zone are the levels that matter most.
Trade the reaction, manage the risk, and let the price confirm the setup.
#QNTRises39% #BitgetBreachForgedRequestsNotStolenKeys #BitcoinSpotETFsTurnNetPositiveYTD #CFTCUpdatesGuidanceOnTokenizedAssets #BinanceWillListHyperliquid(HYPE)
Price is now around 91.56, down 2.26% over the last 24 hours. The 15M chart shows a clear shift in momentum: after recovering toward 94.12, price was rejected and dropped hard to the 90.41 low.
Now the interesting part is the reaction from 90.41.
MA(7): 91.39
MA(25): 92.28
MA(99): 92.62
Price has recovered back above the MA(7), but it is still below the MA(25) and MA(99). That makes the 92.15–92.62 area an important resistance zone to watch.
24H High: 94.88
24H Low: 90.41
24H Volume: 214,092 HYPE
24H USDT Volume: 19.86M
Entry Zone: 91.20 – 91.60
Stop Loss: 90.18
TP1: 92.15
TP2: 92.62
TP3: 93.14
TP4: 94.12
The key support is around 90.40–90.20. If buyers continue defending that area, a recovery toward the moving-average resistance could develop.
But there is no need to chase the move. The real confirmation comes from how HYPE behaves around 92.15 and then 92.62.
A clean reclaim with stronger volume would put 93.14 and 94.12 back on the radar.
HYPE has already shown how quickly this chart can move. Now the 90.40 support and 92.15–92.62 resistance zone are the levels that matter most.
Trade the reaction, manage the risk, and let the price confirm the setup.
#QNTRises39% #BitgetBreachForgedRequestsNotStolenKeys #BitcoinSpotETFsTurnNetPositiveYTD #CFTCUpdatesGuidanceOnTokenizedAssets #BinanceWillListHyperliquid(HYPE)