$BCH Bitcoin Cash (BCH) — Latest Analysis Today, 23 September 2026
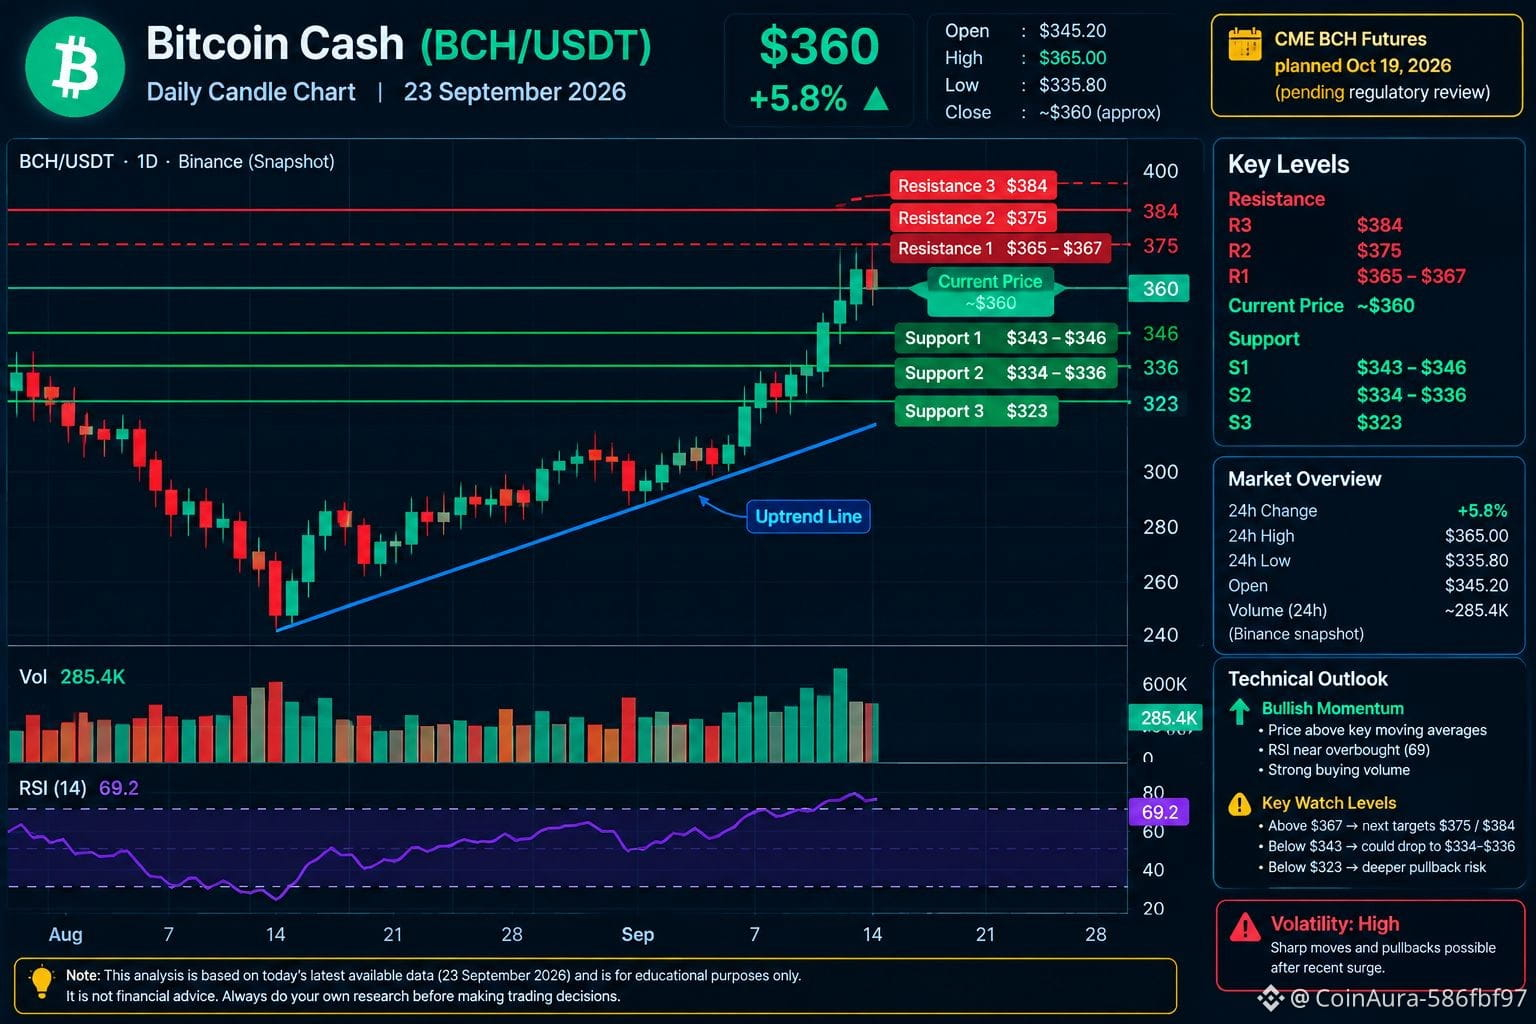
BCH is experiencing a very strong rally today, with Binance data showing approximately $365, up about 5.8% on today's daily candle. The daily range is roughly $335.80–$365.00. �
Investing.com
📊 Key technical levels
Level
Price
🔴 Resistance 3
$384
🔴 Resistance 2
$375
🔴 Resistance 1
$364–$367
🟡 Current area
~$365
🟢 Support 1
$343–$346
🟢 Support 2
$334–$336
🟢 Support 3
$323
These levels are consistent with today's technical pivot calculations. �
Investing.com India
🕯️ Today's candle
Today's move follows an exceptional ~29% gain on September 22, when BCH jumped from about $267 to $345. Today's candle opened around $345.20, reached $365, and traded as low as $335.80. �
Investing.com
The RSI is around 69, while MACD and most moving averages are showing buy signals. That indicates strong momentum, but the RSI is also getting close to an overbought zone. �
Investing.com India
🔥 Why BCH is moving
A major catalyst is CME Group's plan to launch regulated BCH futures on October 19, 2026, pending regulatory review. The announcement triggered a sharp BCH rally and increased derivatives activity. �
FXEmpire +1
What to watch now
Above $367: next technical areas are around $375 → $384.
Above $384: the chart would be entering a new resistance area.
Below $343: momentum could weaken toward $334–$336.
Below $323: would indicate a much deeper pullback.
Because BCH has moved extremely quickly over the last two days, volatility and pullbacks are unusually high. A strong rally does not guarantee that the move will continue.#AIStocksWhatNext #21SharesLaunchesEuropesFirstZcashETP #CardanoJoinsX402PaymentStandard
BCH is experiencing a very strong rally today, with Binance data showing approximately $365, up about 5.8% on today's daily candle. The daily range is roughly $335.80–$365.00. �
Investing.com
📊 Key technical levels
Level
Price
🔴 Resistance 3
$384
🔴 Resistance 2
$375
🔴 Resistance 1
$364–$367
🟡 Current area
~$365
🟢 Support 1
$343–$346
🟢 Support 2
$334–$336
🟢 Support 3
$323
These levels are consistent with today's technical pivot calculations. �
Investing.com India
🕯️ Today's candle
Today's move follows an exceptional ~29% gain on September 22, when BCH jumped from about $267 to $345. Today's candle opened around $345.20, reached $365, and traded as low as $335.80. �
Investing.com
The RSI is around 69, while MACD and most moving averages are showing buy signals. That indicates strong momentum, but the RSI is also getting close to an overbought zone. �
Investing.com India
🔥 Why BCH is moving
A major catalyst is CME Group's plan to launch regulated BCH futures on October 19, 2026, pending regulatory review. The announcement triggered a sharp BCH rally and increased derivatives activity. �
FXEmpire +1
What to watch now
Above $367: next technical areas are around $375 → $384.
Above $384: the chart would be entering a new resistance area.
Below $343: momentum could weaken toward $334–$336.
Below $323: would indicate a much deeper pullback.
Because BCH has moved extremely quickly over the last two days, volatility and pullbacks are unusually high. A strong rally does not guarantee that the move will continue.#AIStocksWhatNext #21SharesLaunchesEuropesFirstZcashETP #CardanoJoinsX402PaymentStandard