No clear edge on BTC right now
📊 $BTC /USDT · Bias: NEUTRAL (No edge) · 4 bullish vs 3 bearish
Technical verdict: NEUTRAL. 4 of 12 signals bullish, 3 bearish, 5 undecided.
What leans up:
🟢 Daily trend: price > EMA50 > EMA200, bullish stack
🟢 4h trend: price > EMA50 > EMA200, bullish stack
🟢 1h trend: price > EMA50 > EMA200, bullish stack
🟢 4h RSI: 65.2, bullish momentum (above 55)
What leans down:
🔴 Trend strength (ADX/DI, 15m): ADX 50.7 with sellers in control (DI+ 10.2 vs DI− 34.5)
🔴 BTC backdrop: BTC trend is bearish and correlation is 1.00
🔴 1h RSI: 39.8, bearish momentum (below 45)
Two scenarios, no position yet:
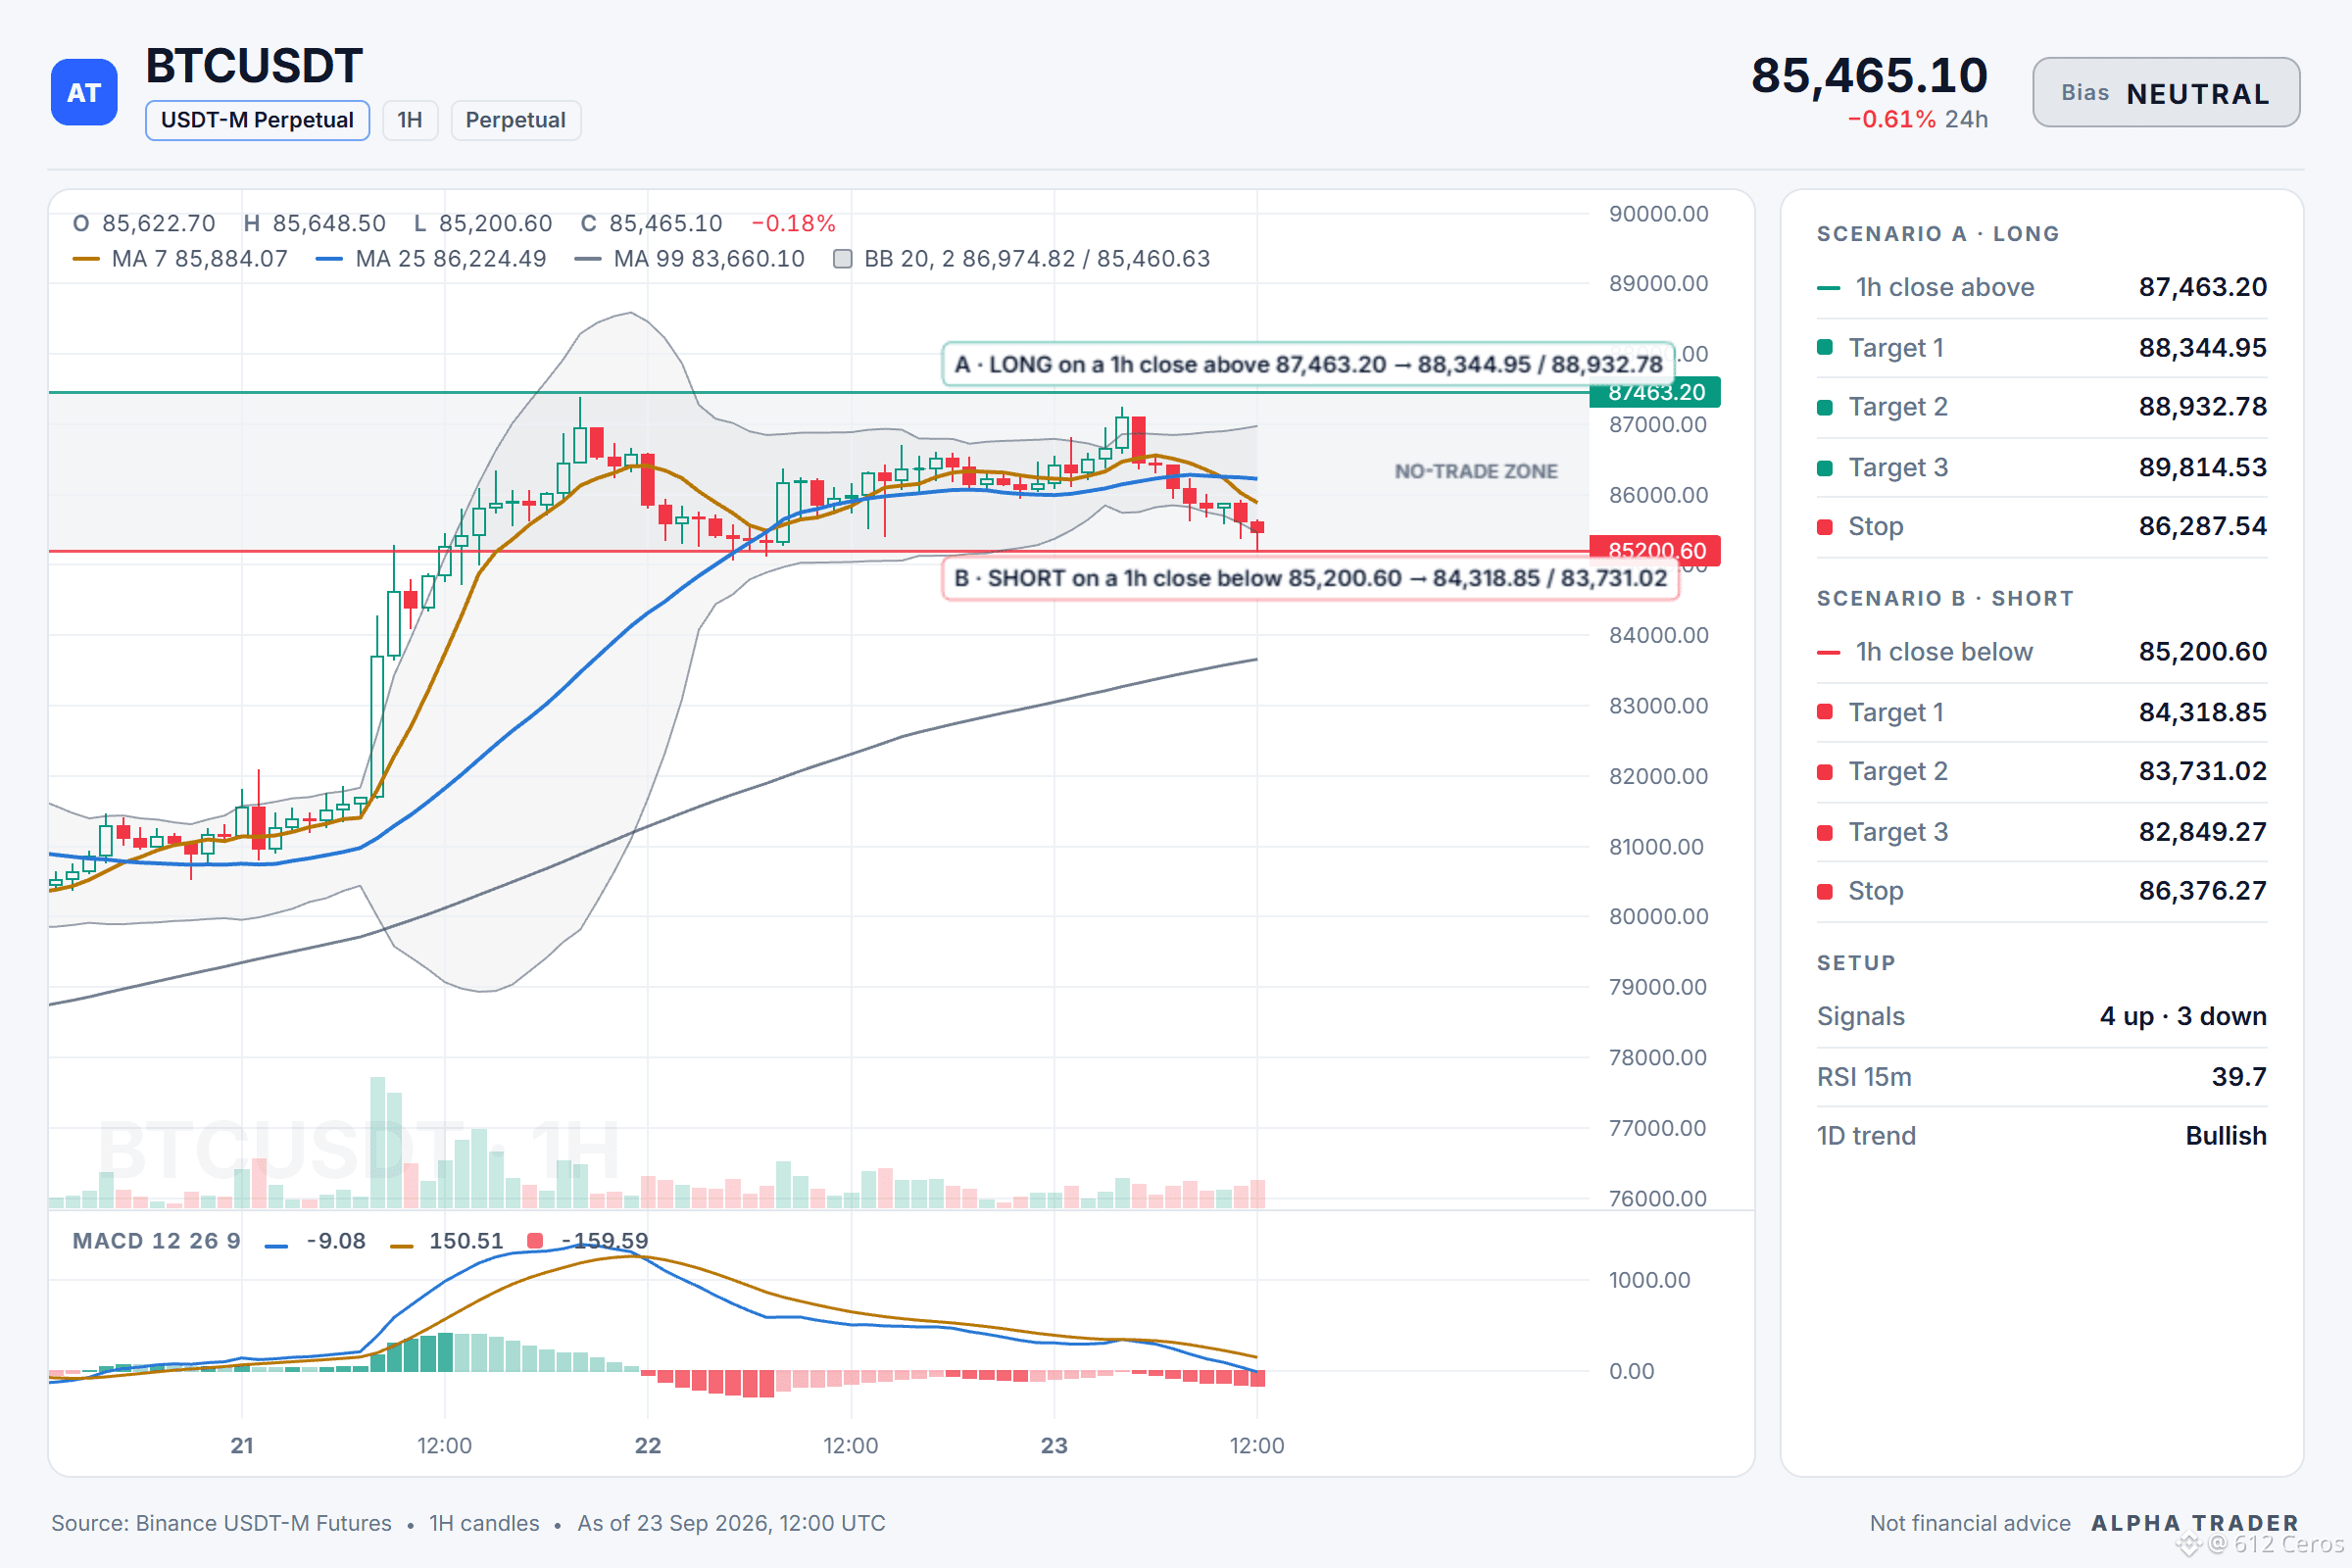
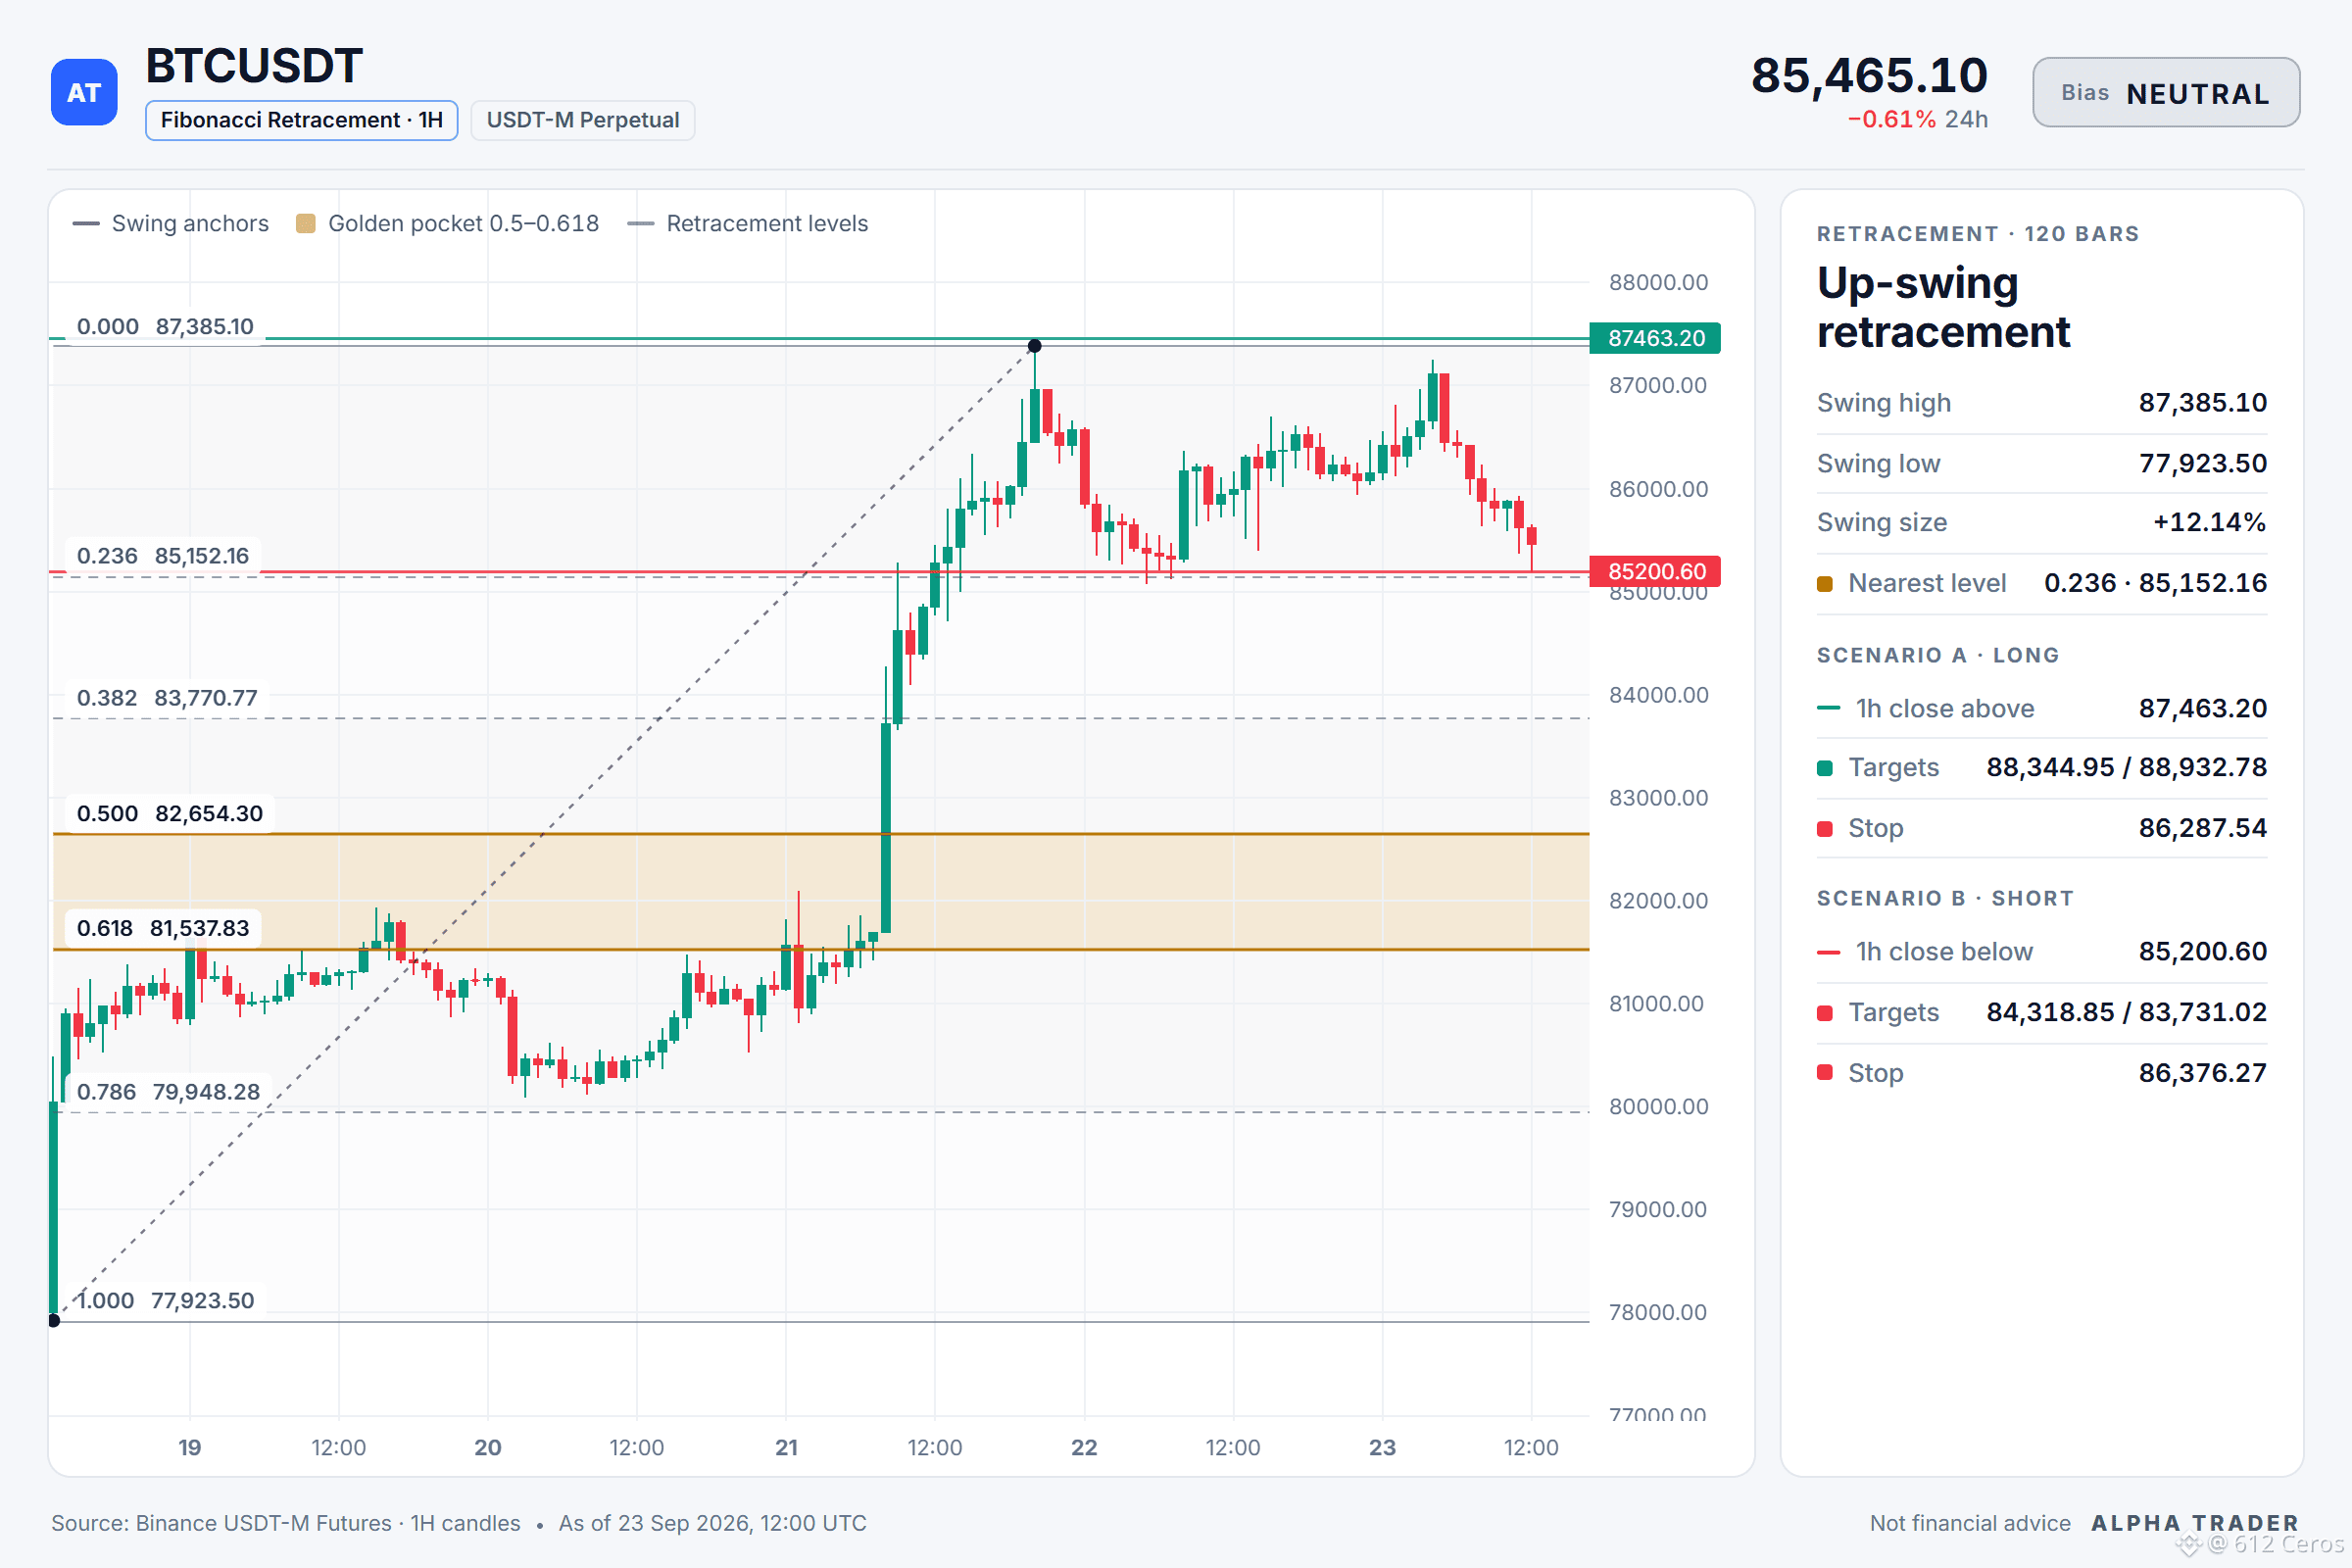
🟢 Scenario A: LONG on a 1h close above 87463.20 (top of the resistance zone)
Trigger 87463.20 → targets 88344.95 / 88932.78 / 89814.53, stop 86287.54
🔴 Scenario B: SHORT on a 1h close below 85200.60 (24h low)
Trigger 85200.60 → targets 84318.85 / 83731.02 / 82849.27, stop 86376.27
⏸ Between 85200.60 and 87463.20 (2.7% wide): no edge, no trade.
My read:
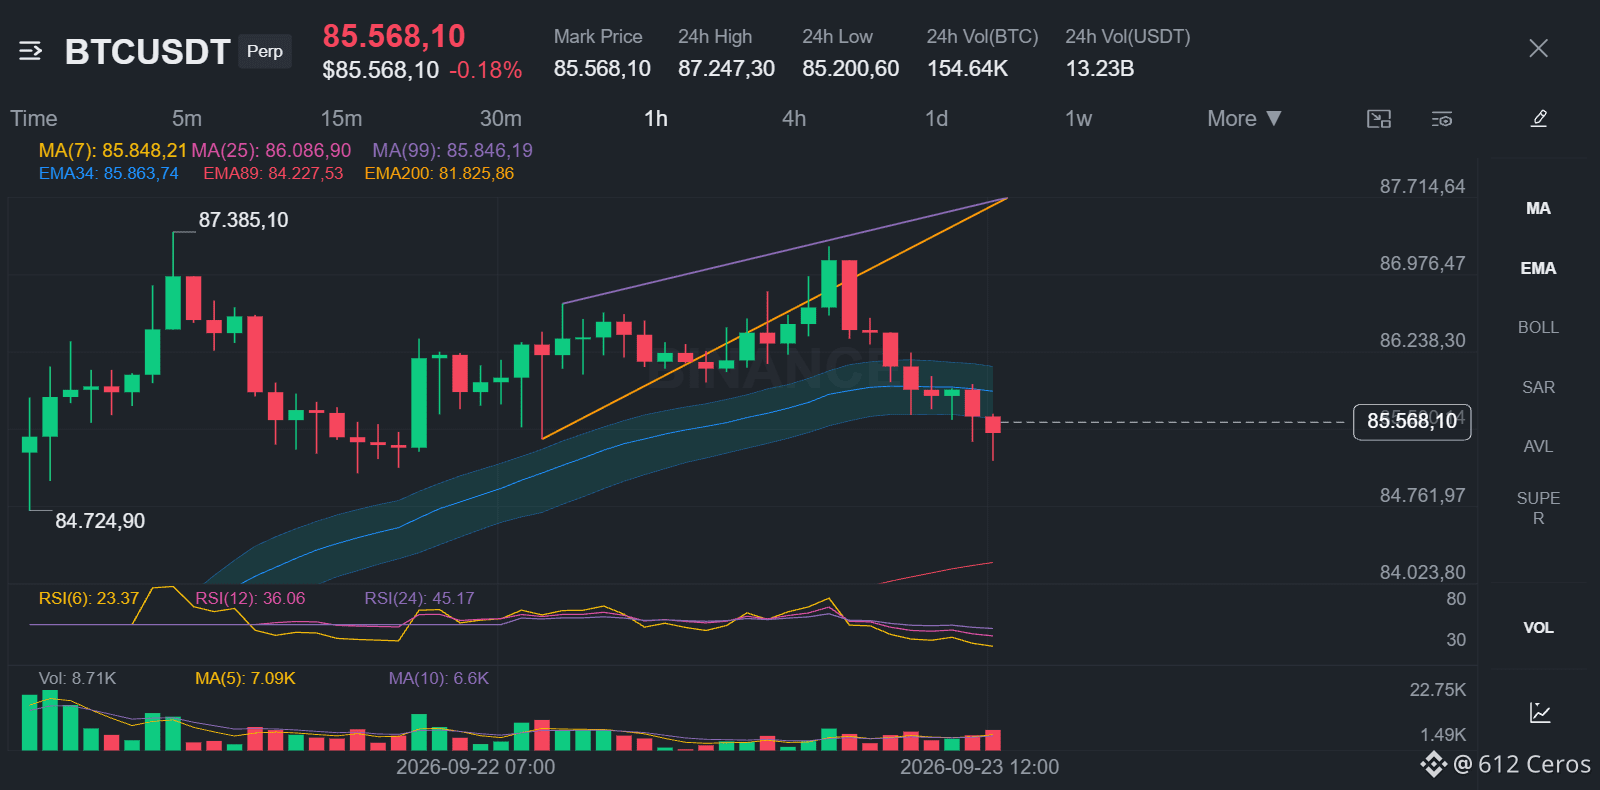
There is no trade for BTC yet. The daily trend is bullish with price above EMA50 above EMA200, and the 4h trend shows the same bullish stack. But the 1h RSI sits at 39.8 with bearish momentum, and ADX at 50.7 shows sellers in control with DI- at 34.5 versus DI+ at 10.2. A bullish scenario needs a 1h close above 87463.20 resistance; a bearish scenario needs a 1h close below 85200.60 support. I am not in either side yet.
Your call:
Which level do you think BTC will violate first, 87463.20 or 85200.60?
Levels mapped on the chart below 👇
⚠️ Personal market analysis only. NFA — manage risk and DYOR.
Educational content, not investment advice or a recommendation to buy, sell, deposit, or withdraw any asset. No paid promotion; the invite link below is my own referral link, and I may earn a commission if you sign up through it — at no extra cost to you.
📲 Want more of my latest signals? Join me here:
https://app.binance.com/uni-qr/D26WbL9t
📊 $BTC /USDT · Bias: NEUTRAL (No edge) · 4 bullish vs 3 bearish
Technical verdict: NEUTRAL. 4 of 12 signals bullish, 3 bearish, 5 undecided.
What leans up:
🟢 Daily trend: price > EMA50 > EMA200, bullish stack
🟢 4h trend: price > EMA50 > EMA200, bullish stack
🟢 1h trend: price > EMA50 > EMA200, bullish stack
🟢 4h RSI: 65.2, bullish momentum (above 55)
What leans down:
🔴 Trend strength (ADX/DI, 15m): ADX 50.7 with sellers in control (DI+ 10.2 vs DI− 34.5)
🔴 BTC backdrop: BTC trend is bearish and correlation is 1.00
🔴 1h RSI: 39.8, bearish momentum (below 45)
Two scenarios, no position yet:
🟢 Scenario A: LONG on a 1h close above 87463.20 (top of the resistance zone)
Trigger 87463.20 → targets 88344.95 / 88932.78 / 89814.53, stop 86287.54
🔴 Scenario B: SHORT on a 1h close below 85200.60 (24h low)
Trigger 85200.60 → targets 84318.85 / 83731.02 / 82849.27, stop 86376.27
⏸ Between 85200.60 and 87463.20 (2.7% wide): no edge, no trade.
My read:
There is no trade for BTC yet. The daily trend is bullish with price above EMA50 above EMA200, and the 4h trend shows the same bullish stack. But the 1h RSI sits at 39.8 with bearish momentum, and ADX at 50.7 shows sellers in control with DI- at 34.5 versus DI+ at 10.2. A bullish scenario needs a 1h close above 87463.20 resistance; a bearish scenario needs a 1h close below 85200.60 support. I am not in either side yet.
Your call:
Which level do you think BTC will violate first, 87463.20 or 85200.60?
Levels mapped on the chart below 👇
⚠️ Personal market analysis only. NFA — manage risk and DYOR.
Educational content, not investment advice or a recommendation to buy, sell, deposit, or withdraw any asset. No paid promotion; the invite link below is my own referral link, and I may earn a commission if you sign up through it — at no extra cost to you.
📲 Want more of my latest signals? Join me here:
https://app.binance.com/uni-qr/D26WbL9t